Hi Helen,
The noise level is calculated as the mean + 3.5 * SD from a portion of the spectrum without signal . You can see by right clicking in a spectrum display, then select estimate noise.
I can suggest a way to visualise/edit graphically from a 1D slice.
Update to the latest version first.
- Select an nD peak, run the macro extractSliceAtPeakPosition from the built-in macros (or find it in the macros section in the forum).
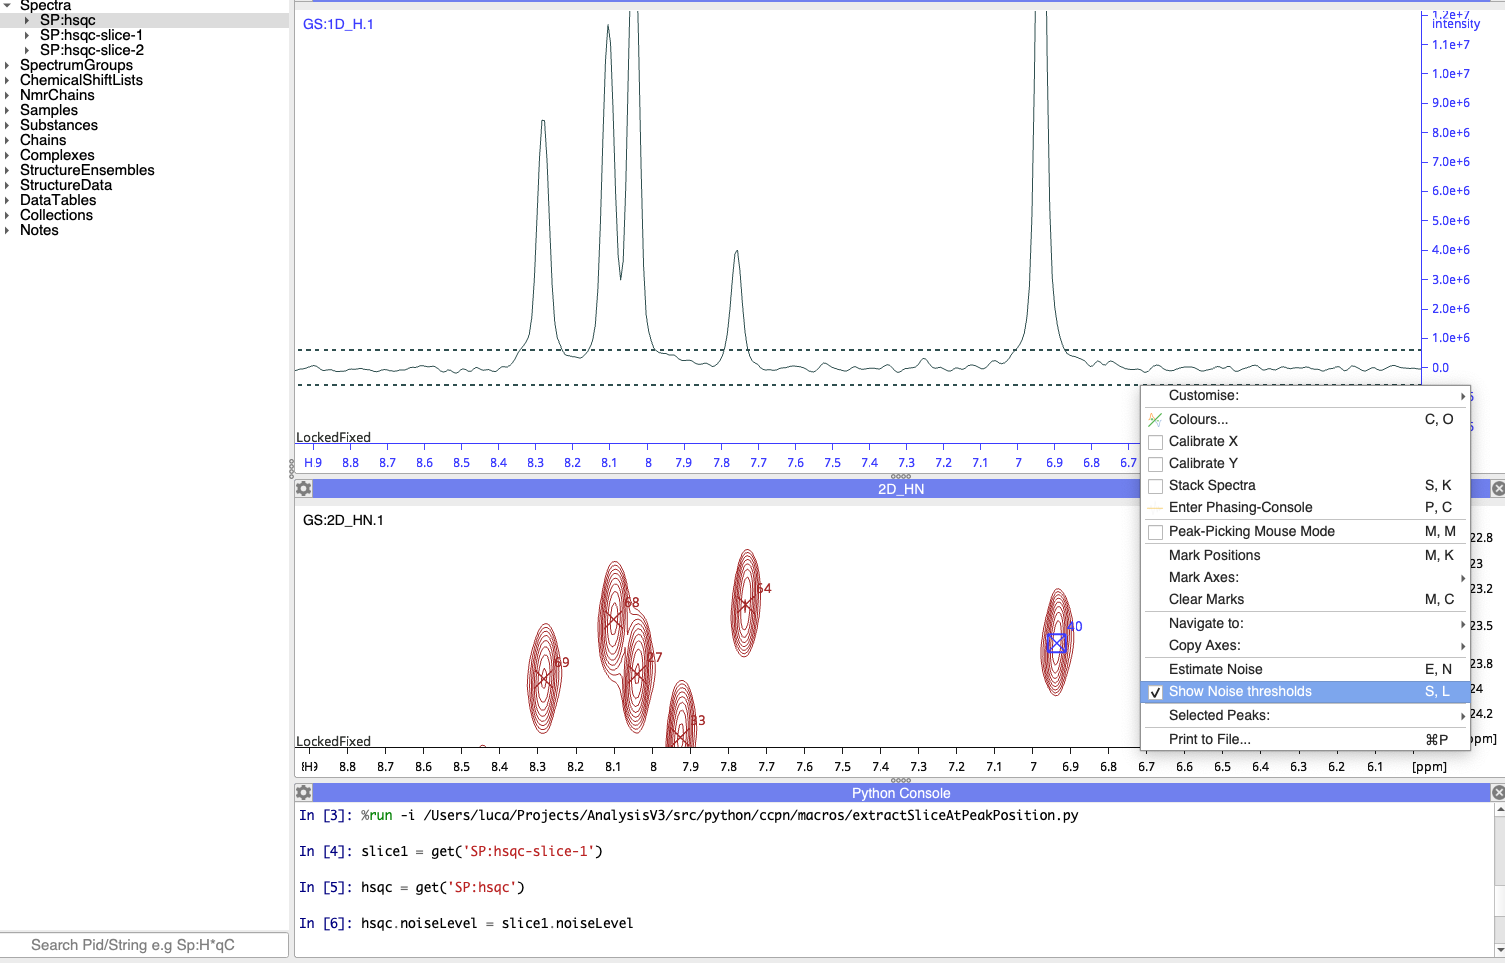
- This will create new 1D spectra (depending on the original peak dims).
- Open a new 1Dspectrum in a new display
- right click and select show noise thresholds
-
- this will show negative and positive noise levels as a horizontal line
- you can also modify it by selecting the line, and dragging up-down to set a new value.
- if you do this, the noise is set only to the 1d spectrum, obviously. but you can simpling amend the nd spectrum by doing:
get(‘SP:spectrumND_name’).noiseLevel = get(‘SP:spectrum1D_name’).noiseLevel