Hey there,
as the title suggests. The ‘Assignment Inspector’ presents a column called ‘Value Error’. Is this the standard deviation calculated on the basis of different experiment types yielding each different/similar values for a given site?
Even further: If I load your BackboneAssignmentTutorial the more-dimensional spectra are surrounded by a rectangle - in hsqc it is pale blueish in colour, in 3D there are also orange horizontal lines. What is the meaning of all this?
The pale rectangle could just mark the measurement area, but what’s the meaning of the orange lines?
The Chemical Shift for a particular NmrAtom is the mean of all the peaks with that assignment in spectra belonging to that Chemical Shift List (by default there is only one: CL:default). And yes, the Value Error is the Standard Deviation of those values.
One additional qualifier though: these values are all scaled by the Peak Merit. So you can exclude peaks from this calculation (and in future we’re going to allow you exclude whole peak lists in one go, but I don’t think that is implemented yet).
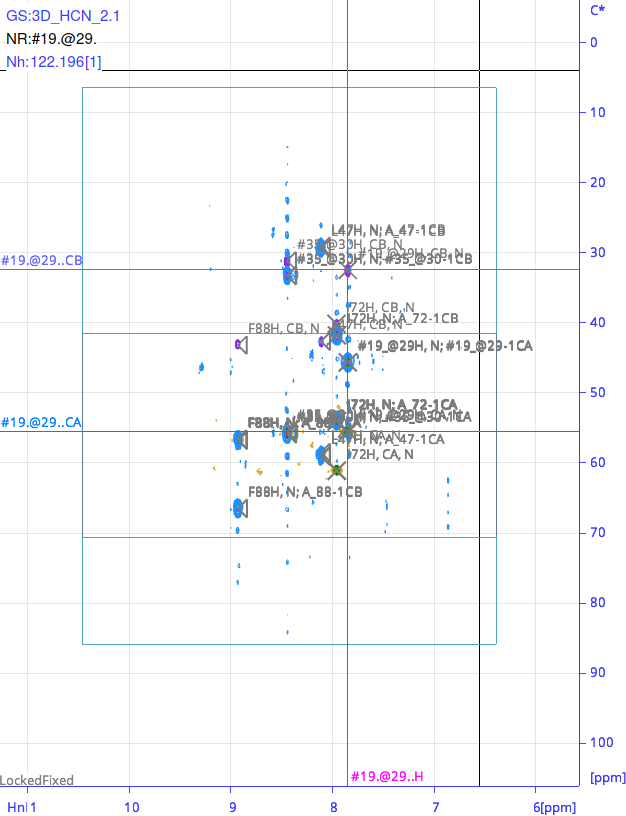
As regards the lines: it’s a bit hard to tell without a figure, but I think these are probably just the spectrum bounds. So every nD spectrum has a box around it in the same colour as the contours to show the area covered/measured by the spectrum. If you switch a spectrum off in the Spectrum Toolbar, you should see those lines disappear. When printing you can choose whether or not to include them.
In the tutorial data, if you overlay the HNCA/HNcoCA spectra with the HNCACB/CBCAcoNH, then you are likely to see the HNCA/HNcoCA bounds half way through your SpectrumDisplay because they are smaller than the other spectra (they don’t include the CB region). I think the only other lines you should see are mouse crosshairs, diagonals, marks (remove these with MC), grid (toggle on off with GS) or MAS sidebands (not relevant for solution NMR data, obviously).
In the attached picture it is visible. As you told, these should be the spectrum bounds. The horizontal appearing lines are just a smaller overlaid rectangles - they all disappear by switching experiments on/off!
big thanks! (sorry for my long delay - influenza stroke me down)