I have a large protein, 300+ residues - I have an unbound HSQC, along with a spectra for a ligand bound, and a spectra for an inhibitor bound. The peaks have moved slightly and I wish to automatically assign from my original assignment to the closest peak in the ligand bound spectra. The copy assignments macro seems to work for only singular peak selections - is there another macro that can automate various assignments at once or another way to do this. Manual would be too time-consuming.
Thanks!
It looks like we do (as part of the Chemical Shift Mapping) - though I’ve only just tried it out for the first time!
Take your unbound and bound spectrum and put them into a SpectrumGroup (easiest is to select both in the sidebar and then right-click / Make Spectrum Group from Selected).
Then go to Spectrum / Peak Collections.
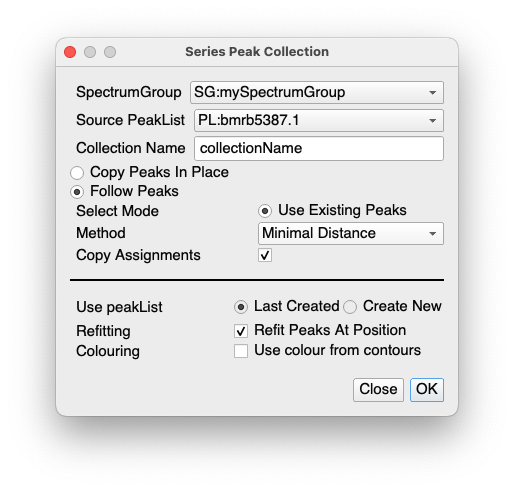
I used the following options:
The main thing is the select Follow Peaks, Use Existing Peaks, Minimal Distance for the Method and then Copy Assignments. And obviously make sure you have your unbound spectrum peak list as the source.
This will create a Collection at the same time which you may not need. But you can use it in the Chemical Shift Mapping module if you then want to look at chemical shift differences.
Vicky
Fantastic, this is exactly what I was looking for, thanks so much Vicky!
1 Like
Just with reference to this chemical shift module, I know in v2 there was a function to calculate chemical shift differences for the same residues between different conditions (i.e., ligand bound and ligand unbound) and plot this in a table, does v3 have a similar functionality? Thanks so much again!
You can use the macro written by Pernille and @bosmith which available at https://ccpn.ac.uk/macro-library/chemical-shift-differences/
The advantage of this, is that it will do the comparison based simply on the Sequence Code, so you can use it for mutants which have different sequences as well as for bound/unbound forms of a protein.
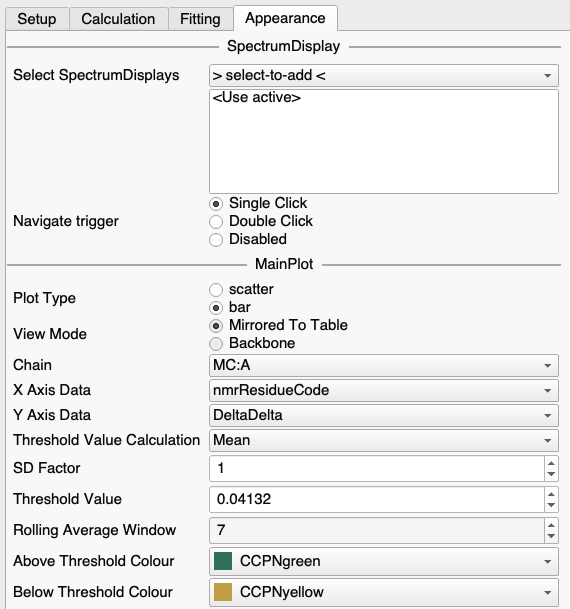
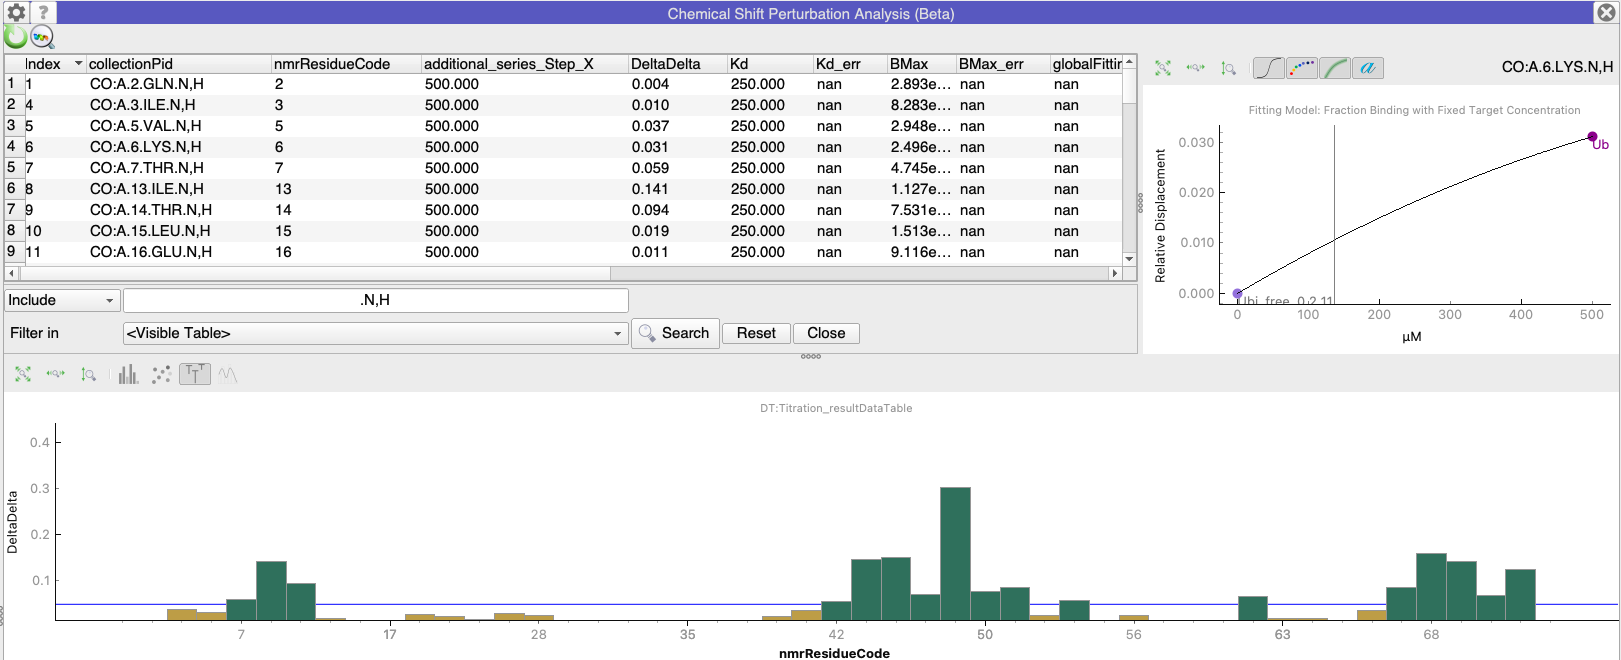
Alternatively, you can misappropriate the Chemical Shift Mapping module if you are looking at e.g. ligand bound and unbound forms which have the same sequence. Simply do all the fittings (but ignore the resulting Kd etc.!) and then plot DeltaDelta on the Y-axis (select this in the Appearance tab of the Settings panel in the Chemical Shift Mapping module).
You’ll probably want to make sure you have excluded any side-chain peaks using the table filtering (right-click / Filter…)
We should really add Chemical Shift Differences more explicitly. I’ll try and bump this up the priorities list a bit!