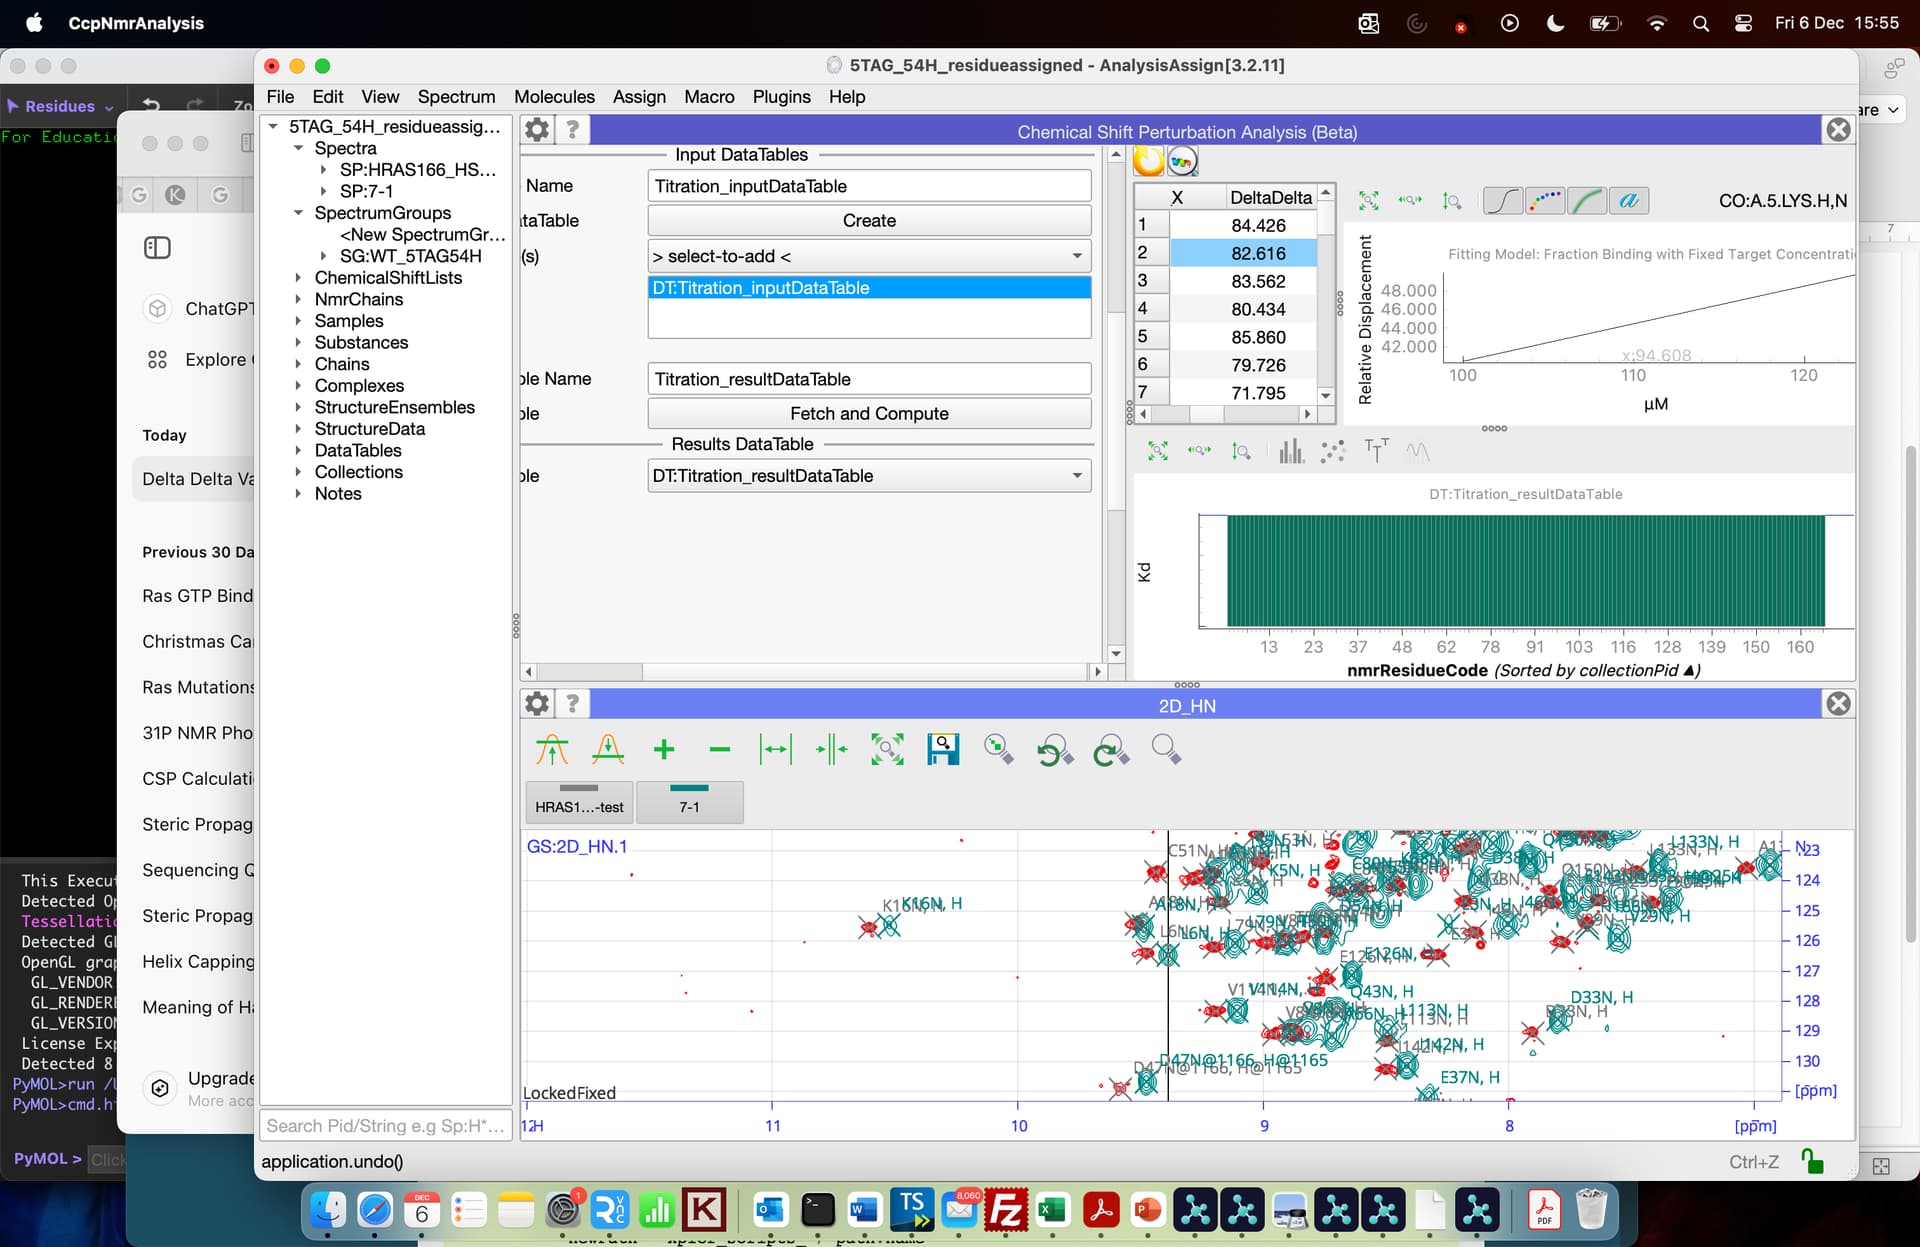
Is there anyone who can help me resolve this bar chart? I am trying chemical shift perturbation beta on v3. I don’t know why the Kd bar chart showing me like this. Also, the delta delta value was unusually high range 70-80
Regards
Is there anyone who can help me resolve this bar chart? I am trying chemical shift perturbation beta on v3. I don’t know why the Kd bar chart showing me like this. Also, the delta delta value was unusually high range 70-80
Regards
This is definitely not what’s supposed to happen but it’s difficult to guess what’s wrong without seeing the project. If you can archive your project and send it to support@ccpn.ac.uk or to me (Brian dot Smith at glasgow.ac.uk) via transfer.gla.ac.uk we can take a look.
Brian Smith
There turned out to be a couple of issues that were giving rise to the problems Reno was seeing.
It turned out that the two HSQCs being compared were stored with the 1H and 15N dimensions in the opposite order, but the assignments had been made so that they matched visually on the display. This meant that one of the spectra had N atoms assigned to H chemical shifts and vice versa. Probably the cause of the very large shift differences.
Switching the assignments could be done quickly for the offending peak list with a couple of lines of code in the python console like
for peak in get('PL:12-1.1').peaks:
   peak.assignDimensions(peak.assignments[0][::-1])
As noted elsewhere, the beta version of the Chemical Shift Perturbation tool isn’t (yet) great for a 2 point comparison as opposed to a titration so I shared a simpler macro to do this bit that should be available in the Macro Library shortly.
Brian
Dear Brian,
That was really helpful with the macro script for the chemical shift mapping.
Regards