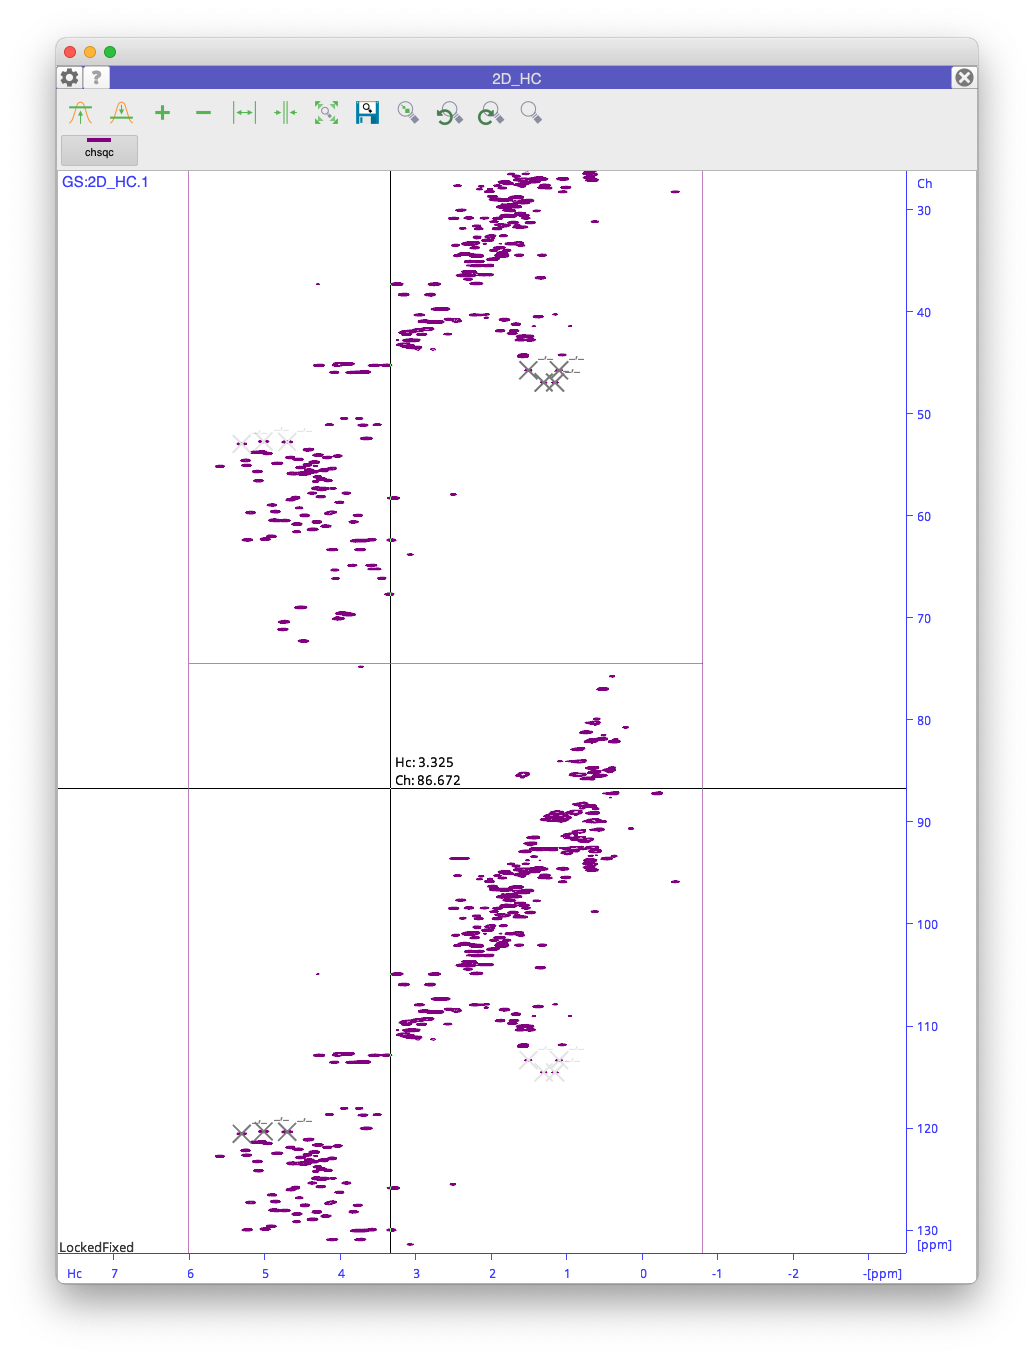
I’ve been working with a modified version of the CNH-NOESY spectrum (https://doi.org/10.1023/A:1008367912535) using a spectral width of 102ppm centred at 56ppm, so the aromatics would be folded (mirrored) and negative between the end of the aliphatics at ~70ppm and the edge of the spectrum at ~107ppm using TPPI folding.
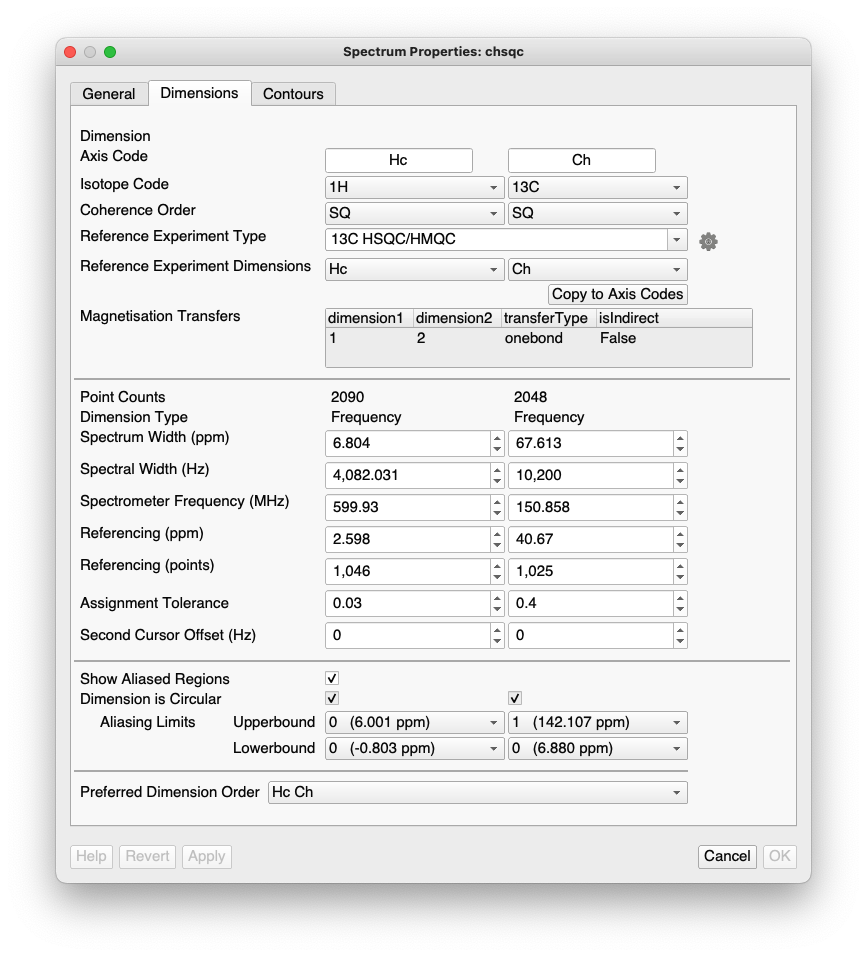
I’m having some issues while trying to use it on a structure calculation with Xplor-NIH 3.8 on Linux Ubuntu 24.04. The first one is that I’m not able to set the folding correctly since the “dimension is circular” tick box is grayed out on the Dimensions tab for the spectrum, and I can’t uncheck it.
For the Reference Experiment Type, I’m in doubt whether to choose C,N,H HSQC-NOESY-HSQC (Hn, Ch, Nh) or CNH (through-space) (Hn, C, Nh), what would be the difference between them?
I decided to run a test without picking the folded aromatic peaks and run a structure calculation using just the aliphatics. I tried using both experiment types, but none of them worked. The CNH_NOESY 1.pass1.pasd is not generated and the structure calculation doesn’t go through. If using other NOESY spectra alongside as input the structure calculation runs, but the CNH_NOESY is not used, and it usually gives a problem in the end and doesn’t generate the ensemble_fold.pdb and ensemble_refine.pdb files.
Can you assist me with this matter, please? Thank you in advance.
I can’t remember exactly why we disabled the “is circular” option, but I think it turned the peak picking into a bit of a nightmare that we haven’t yet had time to solve. There are a couple of possible workarounds:
Process the spectrum twice - once for the aliphatics and once for the aromatics and then read them in as two separate spectra.
Put the aromatic peaks into a separate peak list and then write a macro to correct the carbon ppm values. We could provide help with this if required.
I’m afraid neither of these options is particularly elegant.
In terms of the experiments, I would go for the first one you selected. The difference here is that in the former case the Carbon has to be attached to a proton (because the transfer to C proceeds via an H-H Noesy transfer followed by a scalar coupling transfer from H to C). In the latter case the transfer would be direct to C e.g. via dipolar couplings which are often used in the solid state.
On the structure calculation side of things, @ElizaP might be able to give you more help. My guess is, though, that the experiment type selected in CcpNmr Analysis is not really relevant here and the question is actually whether XPLOR-NIH can handle CNH Noesy data. It may well not be able to, since this isn’t as mainstream as some other Noesy experiments. You may need to contact Charles Schwieters (author of XPLOR-NIH) for more details on that.
So, I’ve done as suggested and processed the spectrum twice and generated the two peak lists. I’ve contacted Charles Schwieters and he managed to make some changes to the scripts and I was able to run a successful structure calculation using this spectrum.
Now my issue is when trying to import the results back to CCPN to analise them, especially with splitting the accepted and rejected peaks into separate peak lists. When I run a structure calculation using both the CNH NOESY and a “regular” NOESY like 15N or 13C this runs with no issues. Then, when trying to do the splitting, it works fine for the other NOESY spectra but not for the CNH ones (it says that all were rejected when it’s not true). That’s when I decided to take a look at the out.nef file and see what the difference was in the output for the peaks derived from the “regular” NOESY and the CNH spectra. The only two things I was able to spot were:
a. There’s an extra line for experiment type (_nef_nmr_spectrum.XplorNIH_experiment_type CNH), which I don’t think would be the issue because it doesn’t relate to output assigned peaks.
b. The names for the spectrum and restraint list are different in the case of the CNH NOESY compared to the other NOESYs, where things have the same name. E.g.:
For the 13C_NOESY: nef_nmr_spectrum_13C_NOESY ‘1’ 111 nef_distance_restraint_list_13C_NOESY’1’ 1
For CNH NOESY: nef_nmr_spectrum_15N 100 nef_distance_restraint_list_CNH_TAMMO’1’ 1
The CNH NOESY spectrum name is listed as ‘15N’ when the restraint list is named ‘CNH_TAMMO’. While for the 13C_NOESY, both lists have the same name (13C_NOESY).
Could that possibly be the issue, or am I missing something?
great that you have managed to get your structure calculation to run!
I think @ElizaP is probably the best person to help you with this query as she is most familiar with this part of the program. It might help, though, if you could send us a copy of the out.nef file to support@ccpn.ac.uk.