Hi all,
I am currently trying to estimate the HeightError and have understood that CCPNMR does not calculate it yet (Having issue calculating peak height errors - #4 by VickyH). Based on the CCPNMR manual, I planned to perform the operation Height / (S/N) through a macro after estimating the S/N using the ‘Visible Area Method’ (The macro here only do the Height / (S/N) operation and fills the HeightError colum).
However, it appears that the error obtained is always significantly higher than the height of my peaks.Also, when I run the macro ‘extractSliceAtPeakPosition’, my noise threshold is higher than my signal.
I don’t understand where the issue is coming from or how to fix it.
Thank you,
Mathilde
Hi Mathilde,
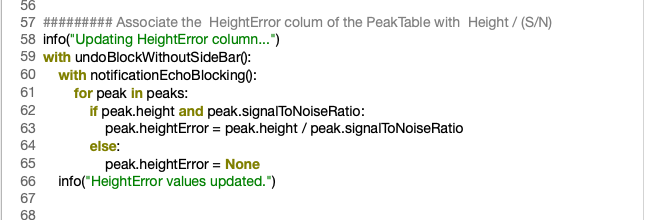
without seeing your macro, it’s slightly hard for me to follow exactly where the problem is arising. The following macro should do what you want (for all currently selected peaks - select all peaks in a peakList with Ctrl/Cmd + A):
for pk in current.peaks:
    pk.heightError = pk.height / pk.signalToNoiseRatio
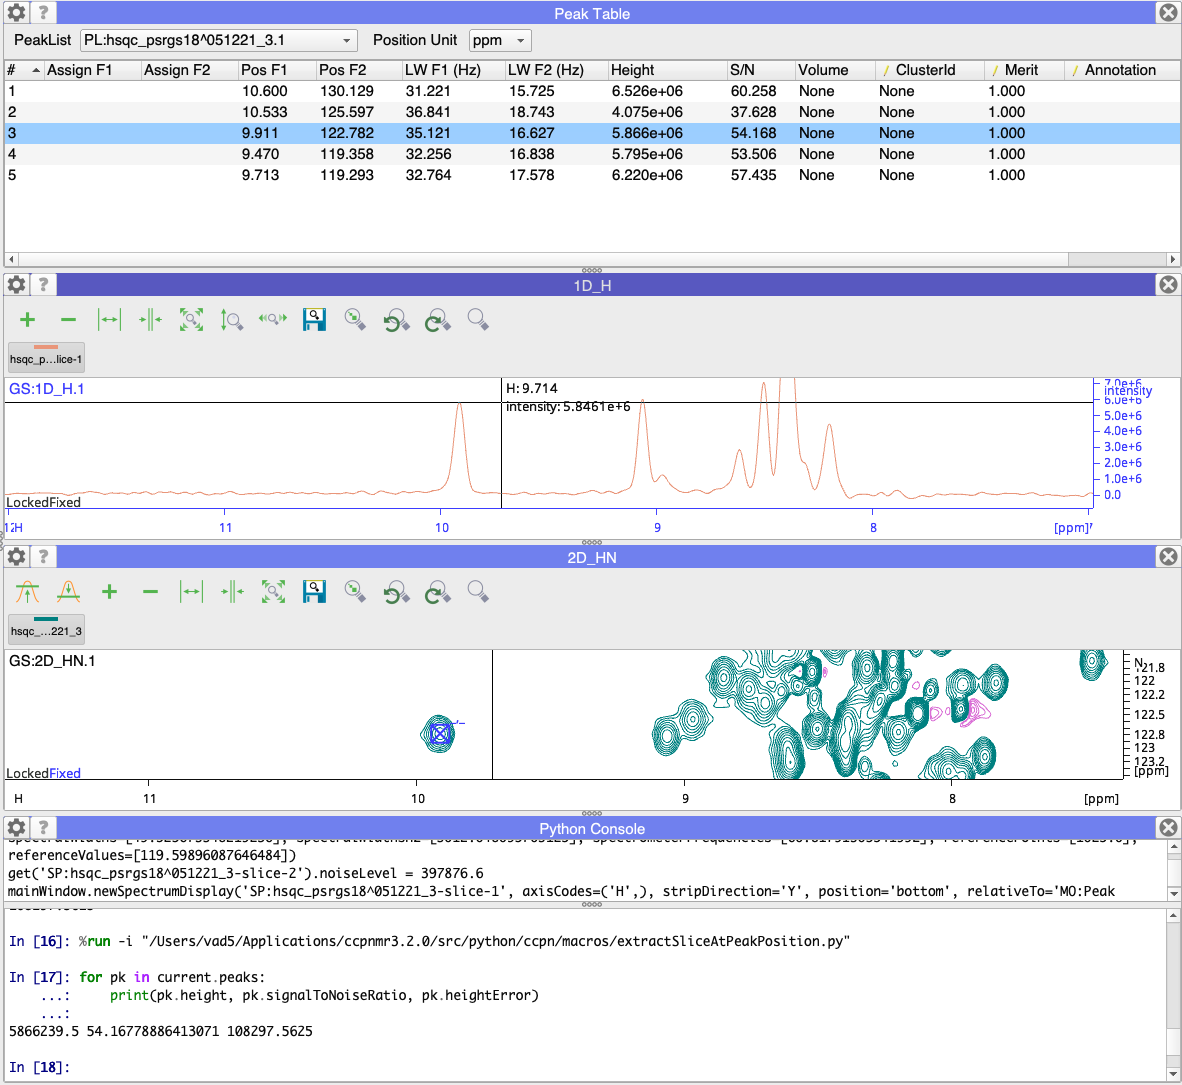
Given our definition of the Signal/Noise here this will give you the standard deviation of the noise. I would certainly expect this to be lower than your peak height. For me that seems to work. If you look at my screenshot below, the height of the peak in the peakTable, in the 1D slice and on the command line are all about 5,866,000. Note that the table, y-axis and 1D mouse position use scientific notation for the peakHeight. In the command line you get the number in full (and LOTS of decimal places for the signal/noise!).
The noise level for the slice (which is carried over from the 2D) also looks reasonable.
Are you doing anything differently?
Vicky
Basically, my macro does the same thing as yours.
But the issue is that the error height is way too high, and I can also see it in the slice with the noise threshold.
Thank you for your help
Mathilde
Hi Mathilde,
it’s looks to me like there are several issues:
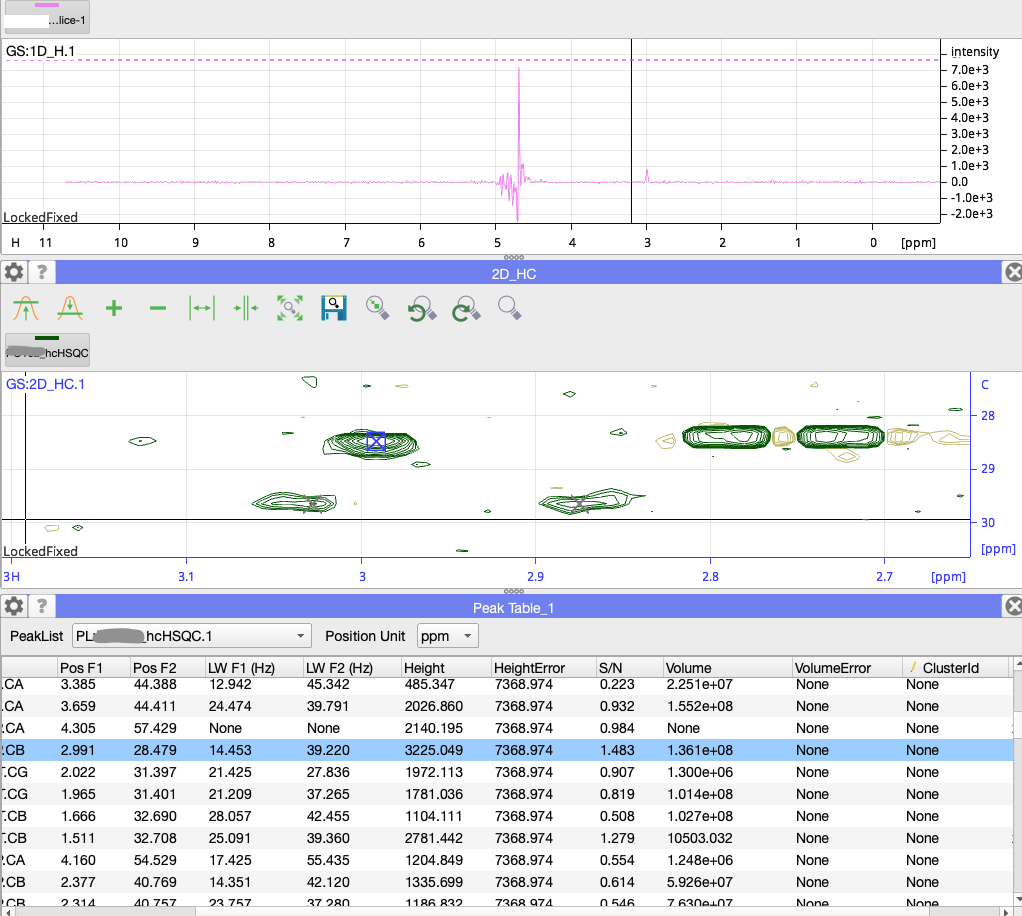
- When I manually divide the Height by the S/N in your table, I get 2174 and not 7368.
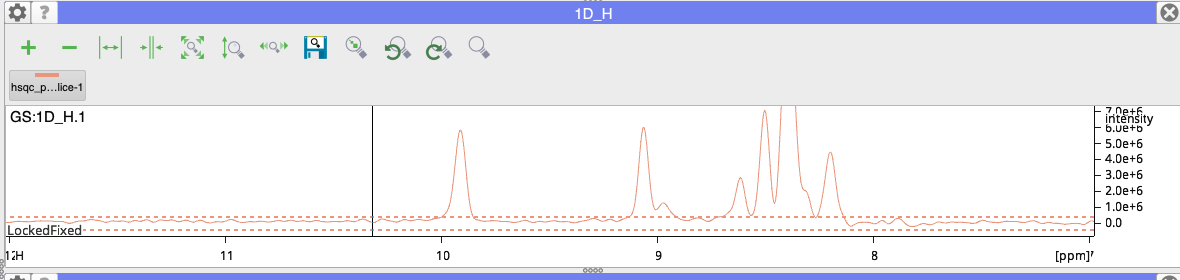
- Even that looks rather high as a noise level (at least in the 1D)
- the peak in your 1D slice looks much too small compared to the one in the 2D.
The best thing might be if you send me your project and the HSQC spectrum (to support@ccpn.ac.uk) and I can take a look at things and see if I can work out where the problem is.
Vicky
Great, I’m sending it. Thanks!
Thanks, Mathilde.
I don’t know where you got your noise level from, but as soon as I re-estimate the noise level everything seems fine.
When you estimate the spectrum noise level with EN, make sure that you have Random Sampling selected at the top (unless you definitely have no peaks showing in your spectrumDisplay at the time). If I do that, then get very reasonable noise levels etc. and everything seems consistent.
So perhaps re-estimate the noise (using Random Sampling), re-run your macro and then re-extract the slice and see if that sorts things out.
Vicky
Thank you for your help. I will use random sampling, as I have already tried it and it gives me more coherent results. However, it still doesn’t explain why the visible area technique is giving a noise level higher than my peak signal. Thanks again for your help!
All I can imagine is that you must have used the visible area method when you had peaks visible in your SpectrumDisplay. This method uses all the points in the area visible in the SpectrumDisplay, so you have to be displaying a part of the spectrum which is only noise. This is obviously slightly unintuitive, as you would normally be viewing peaks and not noise in your SpectrumDisplay! If you do have peaks visible, then those high points will be included in the averaging and skew things. I might see if we can make the Random Method the default one.
Vicky