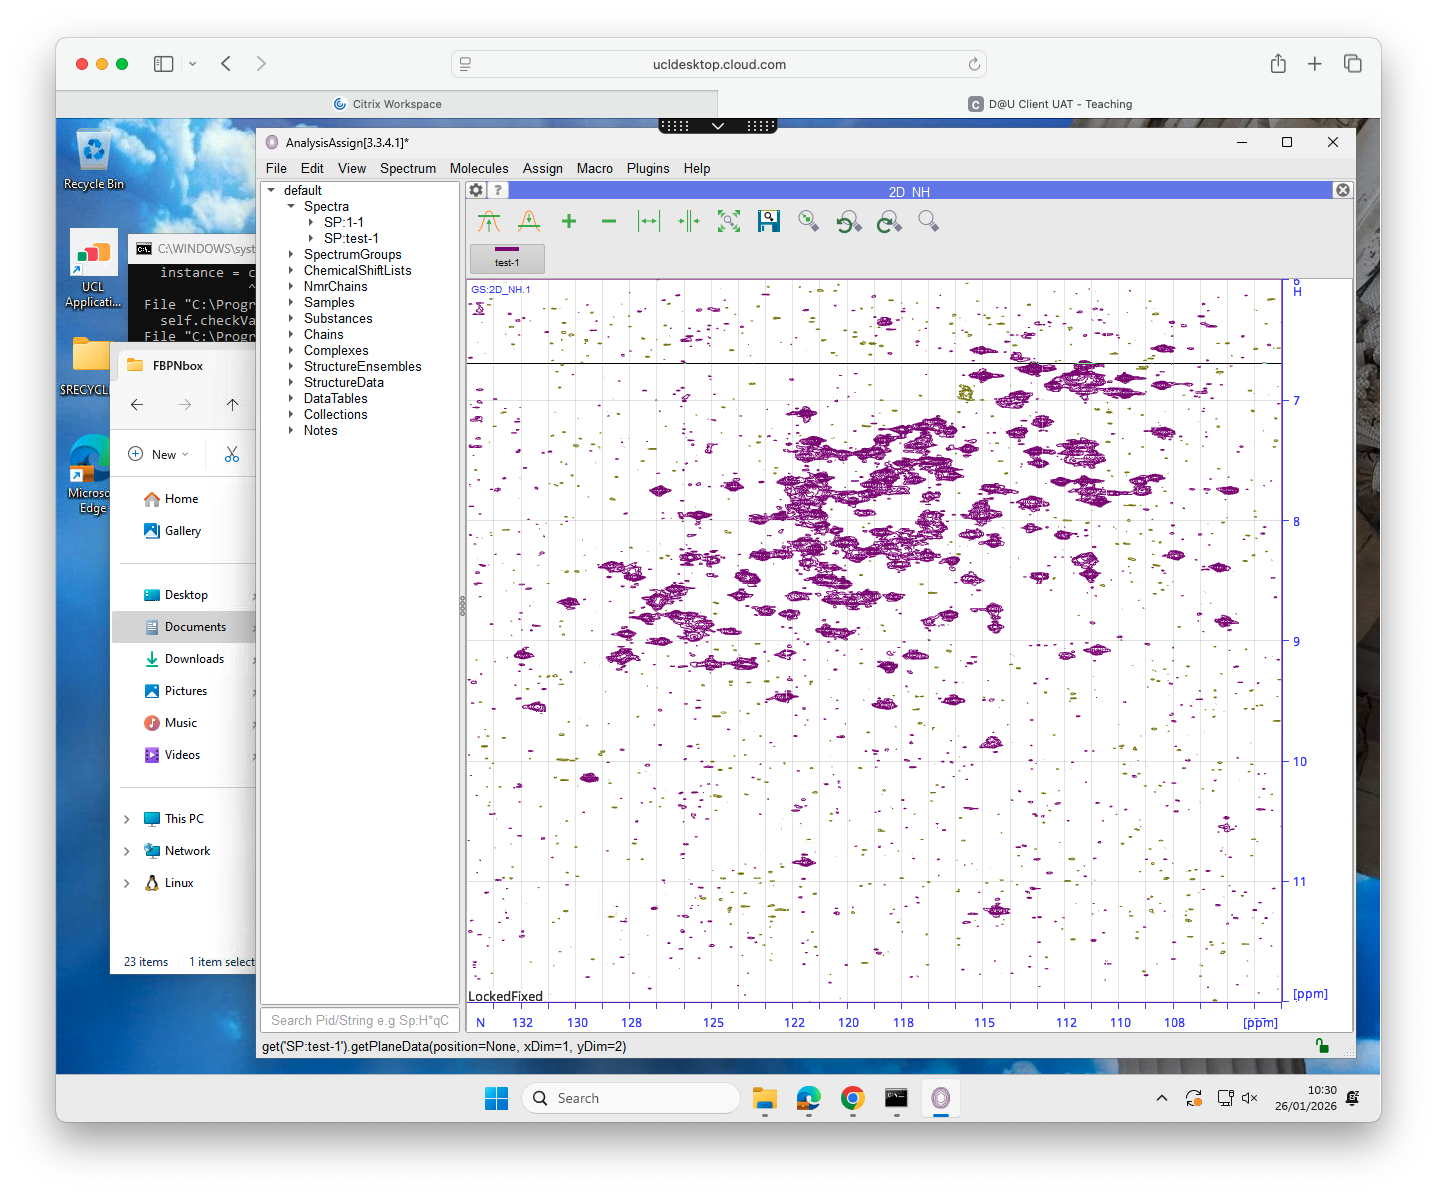
I’m testing out an installation of Analysis 3.2.2 on our teaching cluster but I get an error message when I try to drag data into the window:
OSError: [WinError 1231] The network location cannot be reached. For information about network troubleshooting, see Windows Help: ‘N:\Documents\PHAY0087 NMR data\data\FBPNbox\2\pdata\memops\Implementation’
I get the same error if I select the folder using load data:
OSError: [WinError 1231] The network location cannot be reached. For information about network troubleshooting, see Windows Help: ‘N:\Documents\PHAY0087 NMR data\data\FBPNbox\2\pdata\memops\Implementation’
INFO : application.loadData(‘N:\Documents\PHAY0087 NMR data\data\FBPNbox\2’)
But I can open an nmrPipe file in the same folder without issue.
Any idea if this is a CCPN issue or a UCL IT issue?
We’ve just updated to 3.3.4.1 - the problem still pops up:
Traceback (most recent call last):
  File "C:\Program Files\ccpnmr\src\python\ccpn\ui\gui\widgets\CcpnModuleArea.py", line 216, in dropEvent
    objs = self.mainWindow._processDroppedItems(data)
           ^^^^^^^^^^^^^^^^^^^^^^^^^^^^^^^^^^^^^^^^^^
  File "C:\Program Files\ccpnmr\src\python\ccpn\ui\gui\MainWindow.py", line 1678, in _processDroppedItems
    if not (gotLoader := self.ui._getDataLoader(url)):
                         ^^^^^^^^^^^^^^^^^^^^^^^^^^^
  File "C:\Program Files\ccpnmr\src\python\ccpn\ui\gui\Gui.py", line 611, in _getDataLoader
    _loaders = _checkPathForDataLoader(path=path, formatFilter=formatFilter)
               ^^^^^^^^^^^^^^^^^^^^^^^^^^^^^^^^^^^^^^^^^^^^^^^^^^^^^^^^^^^^^
  File "C:\Program Files\ccpnmr\src\python\ccpn\framework\lib\DataLoaders\DataLoaderABC.py", line 187, in _checkPathForDataLoader
    instance = cls.newFromPath(path)
               ^^^^^^^^^^^^^^^^^^^^^
  File "C:\Program Files\ccpnmr\src\python\ccpn\framework\lib\DataLoaders\DataLoaderABC.py", line 318, in newFromPath
    instance = cls(path=path)
               ^^^^^^^^^^^^^^
  File "C:\Program Files\ccpnmr\src\python\ccpn\framework\lib\DataLoaders\DataLoaderABC.py", line 305, in __init__
    self.checkValid()
  File "C:\Program Files\ccpnmr\src\python\ccpn\framework\lib\DataLoaders\CcpNmrV2ProjectDataLoader.py", line 66, in checkValid
    if not _apiPath.exists():
           ^^^^^^^^^^^^^^^^^
  File "C:\Program Files\ccpnmr\venv\Lib\pathlib.py", line 1235, in exists
    self.stat()
  File "C:\Program Files\ccpnmr\venv\Lib\pathlib.py", line 1013, in stat
    return os.stat(self, follow_symlinks=follow_symlinks)
           ^^^^^^^^^^^^^^^^^^^^^^^^^^^^^^^^^^^^^^^^^^^^^^
OSError: [WinError 1231] The network location cannot be reached. For information about network troubleshooting, see Windows Help: 'N:\\Documents\\PHAY0087 NMR data\\data\\FBPNbox\\1\\memops\\Implementation'
It only affects dragging folders of bruker data into CCPN - if I drill down and drag in the 2rr file that seems to work OK. Equally I can drag in nmrPipe spectra OK (though they’re displayed wrongly transposed!).
we’re struggling to work out what the problem is here. Other Windows users are fine dragging in their Bruker data at any level of the file structure.
What does the path shown in the final error message lead to?:
N:\Documents\PHAY0087 NMR data\data\FBPNbox\1\memops\Implementation
Does that exist? Is this where your data is? Or Project? Or program installation?
Just to clarify: the program is installed locally, but you are trying to access spectrum files on a network drive? We wouldn’t have expected that to be a problem. Similarly, spaces should be fine as long as they are only in a path and not in the project name.
As for the nmrPipe spectra: again not something that anyone has ever reported before (and I doubt you are the only one using the NMRPipe/CcpNmr Analysis combination). And I’m also not quite sure what you mean with “transposed”. Is it opening the spectrum as N on x and H on y or has it actually labelled the H-axis as being Nitrogen and vice versa? How did you label the axes/dimensions in NmrPipe?
Just confirming that I can’t currently reproduce this on my Windows installation.
At least the you have a workaround by dragging the processed data file.
Does the issue also occur for data stored at different locations (such as the local C: drive etc.)?
One thing I do note is the path has a space in it… and it definitely looks like a network drive [N is quite a high drive letter]
Could you open command prompt and type net use and report the output Chris?
regards
Gary
Dr Gary S Thompson NMR Facility Manager
CCPN CoI & Working Group Member
Wellcome Trust Biomolecular NMR Facility
School of Natural Sciences
University of Kent, Canterbury, Kent, England, CT2 7NZ
The error I get occurs when I try to drag in a Bruker experiment folder - i.e. the folder enclosing pdata/1/2rr. There’s no folders called memops\Implementation around. I get a similar error if I dig down and drag in the pdata/1 folder - but I can successfully drag in the 2rr file.
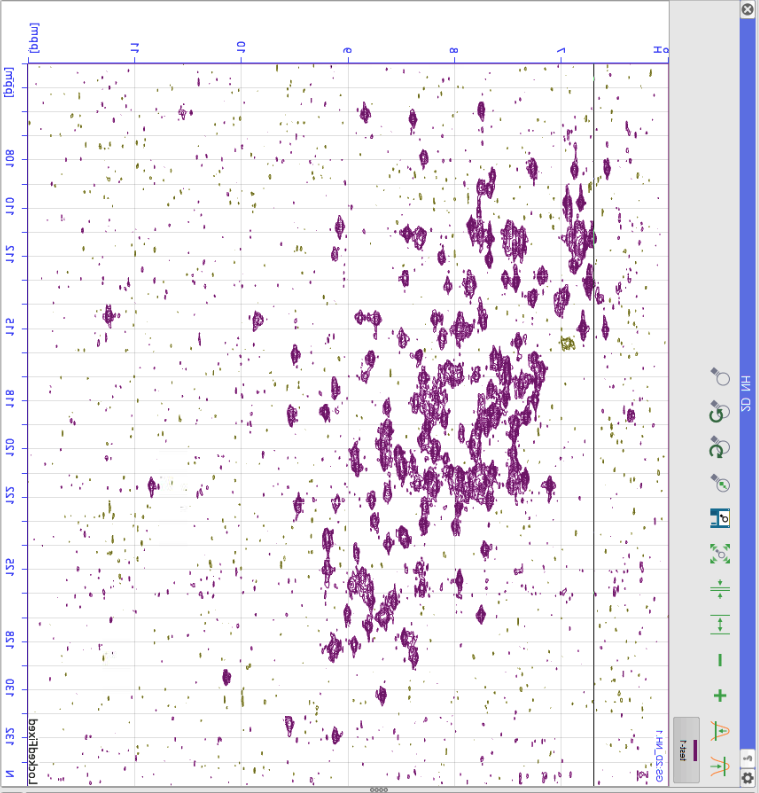
When I say the nmrPipe data appears transposed, I mean that by default it presents with x=N, y=H:
C:\Users\ucbtcwa>net use
New connections will be remembered.


Status       Local     Remote                    Network

-------------------------------------------------------------------------------
OK           A:        \\unix-home.ucl.ac.uk\ucbtcwa
                                                Microsoft Windows Network
             N:        \\IAMCloud\N_9396\OneDrive
                                                IAMCloudFsp.Np
             S:        \\ad.ucl.ac.uk\GroupFolders
                                                Microsoft Windows Network
The command completed successfully.
On the nmrPipe issue:
Generally I thought that for any NH spectrum the program will by default put H on x and N and y.
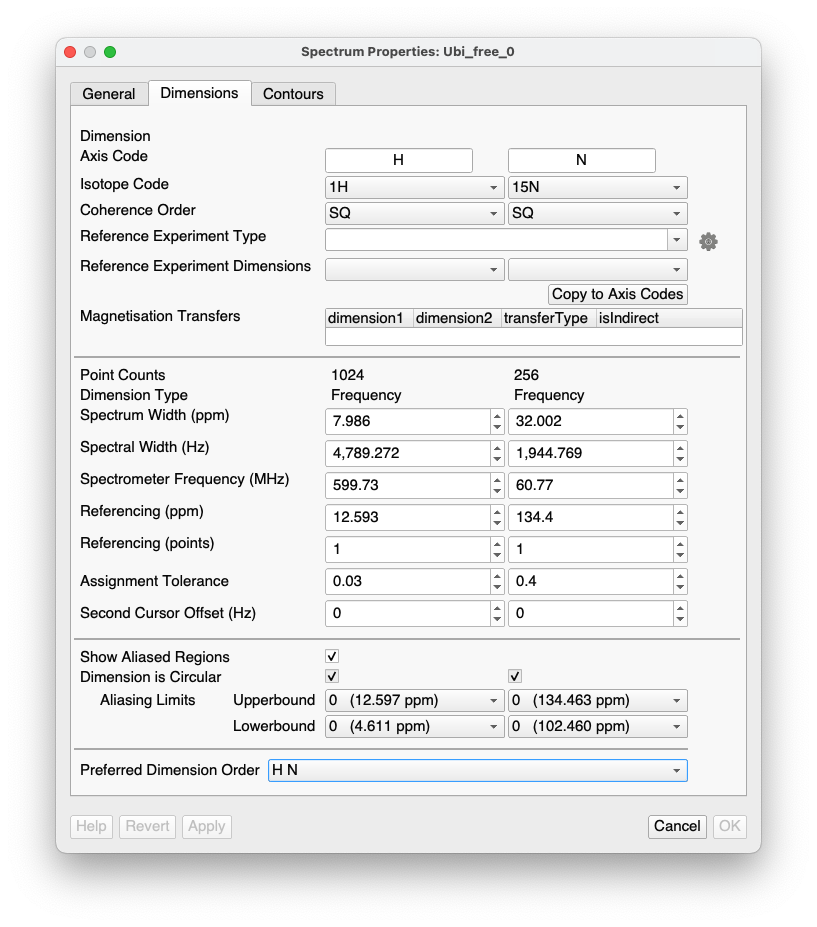
If you double-click on the spectrum in the sidebar and go to the Dimensions tab, it would be worth checking that it has identified the dimensions correctly. At the bottom there should be a “Preferred Dimensions Order”. Make sure that is set to HN and not NH.
As I say, I thought HN was the default - so either something is overriding that for some reason, or the dimensions have been linked incorrectly. But the latter strikes me as unlikely, since simply swapping the axes gives something that looks like a normal HSQC with sensible chemical shift ranges and the Asn/Gln NH2 groups in the right place:
I think the problem comes from the way NMRPipe processes the data. It transposes the spectrum to process the N, and I have encountered the same problem when opening NMRPipe data in Analysis.
What I do now is that I add copy the script line with the transpose command (-TP) so it runs again at the end of my NMRPipe script. This way, after transposing to process N, it transposes back to the original orientation. Once I started doing that, the data opens as normal. (x=H,y=N)
but out libraries should be taking care of this, so really its a bug…
regards
Gary
Dr Gary S Thompson NMR Facility Manager
CCPN CoI & Working Group Member
Wellcome Trust Biomolecular NMR Facility
School of Natural Sciences
University of Kent, Canterbury, Kent, England, CT2 7NZ
I don’t think it’s a bug. There’s nothing intrinsic to the data that says it should be plotted with the 1H axis horizontal and the 15N axis vertical on the screen - that’s a user choice. If the user provides data transposed from the normal convention, it’s not a problem since the CCPN software already provides at least two easy ways to fix this in the way it’s displayed.
The order of the default spectrum display is set by a user setting
Preferred dimension order in spectrum properties
As I understand the belief is that the problem is that the dimensions are being transposed from this possibly because we aren’t read a tp flag somewhere…
Happy to be proved wrong but I believe that was the current hypothesis from out meeting on Tuesday, Luca and Ed may disagree in which case I defer to them ;-) hence most probably a bug…
regards
gary
Dr Gary S Thompson NMR Facility Manager
CCPN CoI & Working Group Member
Wellcome Trust Biomolecular NMR Facility
School of Natural Sciences
University of Kent, Canterbury, Kent, England, CT2 7NZ
Yes, @bosmith it is a user choice as to how to display the spectrum (and can be set in the Spectrum Properties), but nonetheless we decided some time ago that by default we would display spectra in the following way:
2Ds - proton preferentially on the x-axis
3Ds - triple resonance spectra as HCN and spectra with two dimensions belonging to the same isotope on x and y (i.e. HHC, HHC, CCN etc.).
For some reason the code wasn’t actually implementing these rules as it should have done, so @varioustoxins is right that this is a bug. (The code basically assumed that H is always in the first dimension, which in @cwaudby’s spectrum it was not - as @tblumens rightly surmised). I fixed this yesterday, but I don’t think @ejb has put it on the update server yet. I’ll remind him today. I was going to wait with posting something until he had done it.
So this is the definition of what the preferences should be based on what mix of nuclei you have, but the user can decide something different*…?
2Ds - proton preferentially on the x-axis
3Ds - triple resonance spectra as HCN and spectra with two dimensions belonging to the same isotope on x and y (i.e. HHC, HHC, CCN etc.).
I think you can only decide of a different choice locally on a spectrum not globally? Dow we have definitions for direct detect spectra as well [con can etc]
Dr Gary S Thompson NMR Facility Manager
CCPN CoI & Working Group Member
Wellcome Trust Biomolecular NMR Facility
School of Natural Sciences
University of Kent, Canterbury, Kent, England, CT2 7NZ
At the moment the user can only decide on something different locally/individually for each spectrum.
And the only carbon/nitrogen-detect rule we have concerns e.g. CCN spectra. I guess we could say that by preference an NC spectrum should have Carbon on the x-axis.
I realise there are some people who will do C-direct detect with H in an indirect dimension - for them this is going to throw up something unexpected. But I think they are probably in the minority.
We could have endless discussions about whether users such as Chris should transpose their spectrum in nmrPipe or whether we should default to showing an NH spectrum always with H on the x-axis. I think the latter isn’t an unreasonable thing to do and more likely to be helpful to inexperienced NMR spectroscopists.