Hi!
Can you please tell me what is the formula used for calculating CSPs (Ddelta) in the Chemical shift mapping-section of V3?
Kind regards,
Helena
Hi Helena,
it should be the one given in the paper https://doi.org/10.1111/febs.14771
Not so easy to recreate without formatting...
CSP(i) = SQRT { (Dd(Hi)2 + 0.14(Dd(Ni)2 }
where Dd is the change in chemical shift of residue i in the H or N dimension.
Vicky
Thank you Vicky,
How are the H, N relative contributions incorporated into the Ddelta formula?
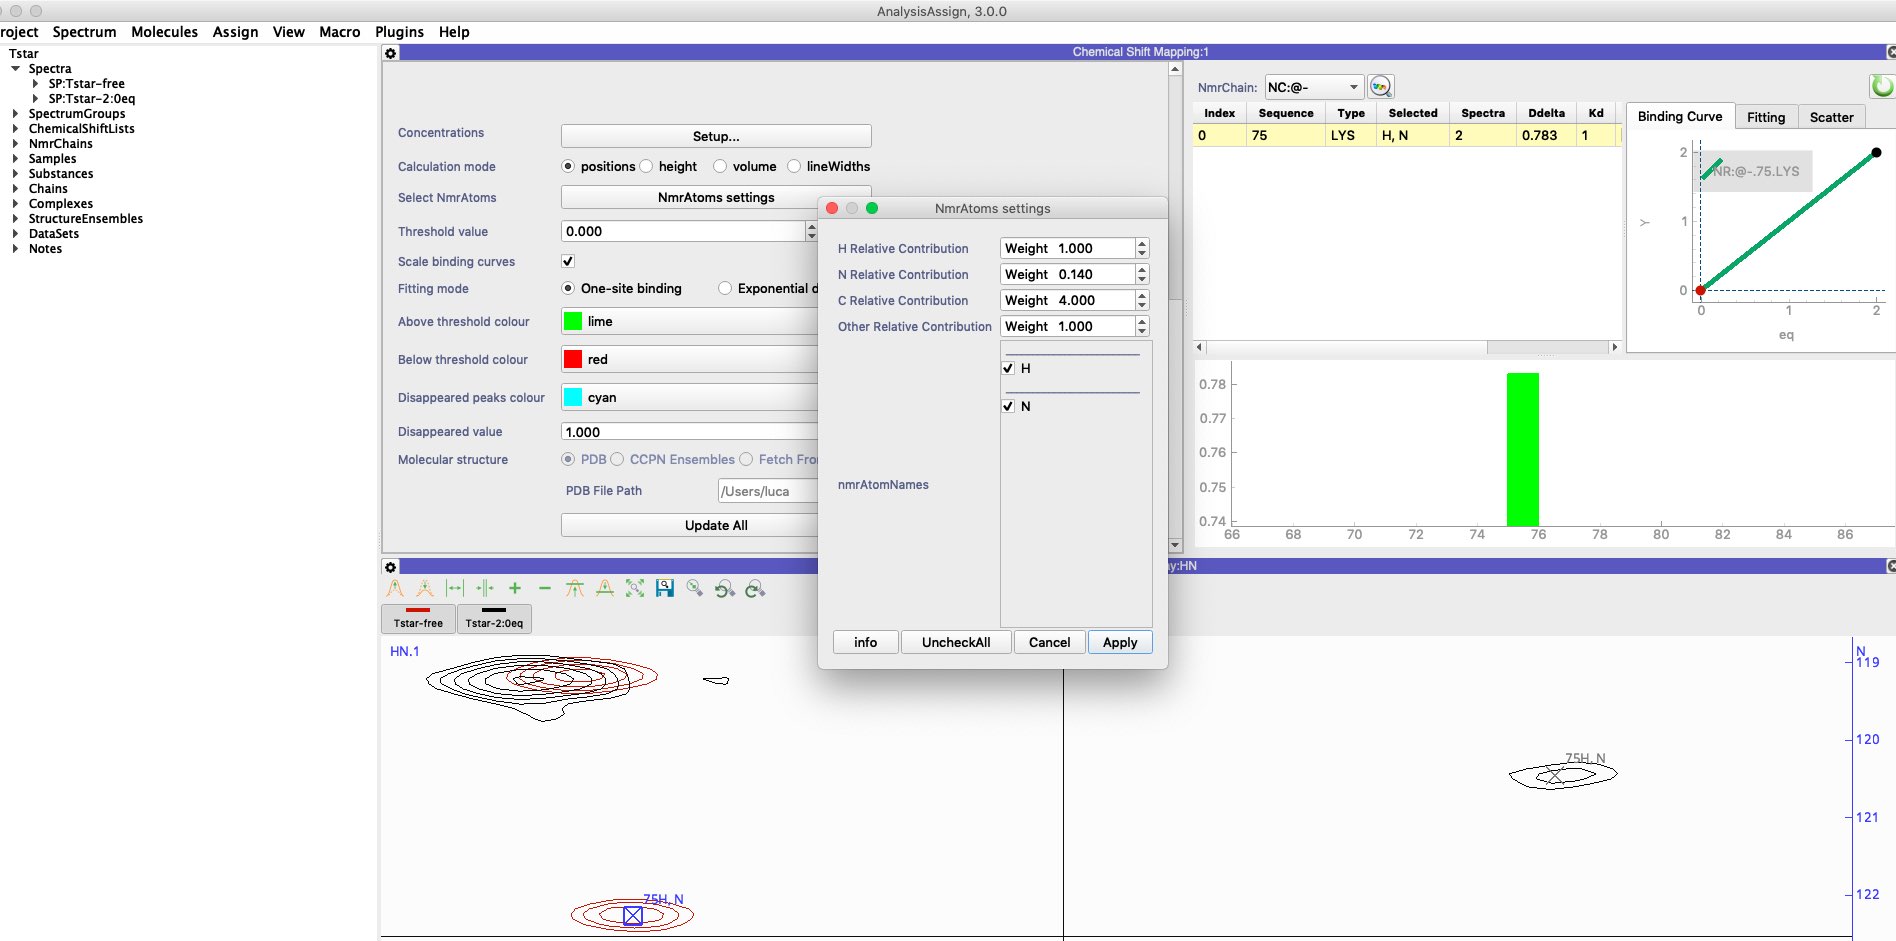
From the Tstar tutorial, K75
free 122.260, 7.194
2:0eq 120.449, 6.801
SQRT{(7.194-6.801)^2 + 0.14*(122.260-120.449)^2} = 0.78
Is this right?
If I choose from `NmrAtoms settings` relative contributions of H=1.0, N=1.0, the Ddelta for K75 is 1.17.
With the tutorial default values H=6.5, N=1.0, Ddelta for K75 is 1.98. How can I reproduce Ddelta=0.78?
Kind regards, Helena
Hi Helena,
I just noticed there was an issue in one of the latest updates, preventing the relative contribution to be passed in the formula. We will send the correction this morning.
FYI, on the table you have the Deltadeltas of all perturbations. That means if you want see the 0.78, you need to select as input spectra only the tStar-free and tstar-2:0eq, in the settings panel. For the contributions, open the popup NmrAtoms Settings, type 1 for H and 0.14 for N. Ok, and update module.
I hope this helps.
Best
Luca
Many thanks!
Kind regards,
Helena
Hi again Vicky, Luca
A question related to the calculation of Ddelta, and Chemical Shift Mapping module:
What is the the equation to which the CSPs (and P, L concentrations) are fitted in order to obtain Kd?
I am trying to figure out why I obtain a significantly different value of Kd for an old titration study, previously obtained by fitting data using SigmaPlot.
Kind regards,
Helena
Hi,
kDs are estimated using a non-linear fitting routine as in the paper from Williamson: https://www.sciencedirect.com/science/ar...via%3Dihub
I hope this helps.
(10-24-2019, 05:29 pm)LucaM Wrote: Hi,
kDs are estimated using a non-linear fitting routine as in the paper from Williamson: https://www.sciencedirect.com/science/article/pii/S0079656513000265?via%3Dihub
I hope this helps.
Hi Luca,
Just wondering if equation 6 from this paper is used for the non-linear fitting for estimating Kd? If so, I understand that in the CSP module under Select input data - Concentration - Setup that you can input the ligand concentration (molar) for each spectra, but where do you input protein concentration?
Thanks in advance,
Iona
(10-16-2019, 10:34 am)LucaM Wrote: Hi Helena,
I just noticed there was an issue in one of the latest updates, preventing the relative contribution to be passed in the formula. We will send the correction this morning.
FYI, on the table you have the Deltadeltas of all perturbations. That means if you want see the 0.78, you need to select as input spectra only the tStar-free and tstar-2:0eq, in the settings panel. For the contributions, open the popup NmrAtoms Settings, type 1 for H and 0.14 for N. Ok, and update module.
I hope this helps.
Best
Luca
Hi Luca,
I was just trying this and it is not possible to change the contribution for N to 0.14, it accepts 0.1 or 0.2.
I have just downloaded the new V3 on to a new windows 10 laptop if that has any bearing.
thanks,
Ken
Hi Ken,
just had a look at this. If you use H 7 and N 1, then you get the same ratio and it should work.
I`ll check with Luca if there is some issue that it won`t take numbers below 1 or something like that. I certainly agree that it is confusing, and that it should be equally possible to use H 1 and N 0.14 rather than H 7 and N 1.
Best wishes,
Vicky
Hi Vicky,
it is the same ratio but then gives a completely wrong value for the CSP! You need to be able to follow the formula above so the actual numbers matter.
thanks,
Ken
Hi,
the other aspect that appears to be missing is the protein concentration. This also has an effect on the KD. Have I just overlooked it?
thanks,
Ken
Hi Ken,
you may have overlooked this, though upon investigating I did also find a few errors which we shall fix.
In the module settings, just below the Spectrum Selection, you should see a line called `Concentrations` with a button `Setup...`. Click here to set your concentrations. However, at the moment this only seems to be working correctly if you select your spectra via `Spectra` rather than `Groups`. So perhaps that is where you got stuck.
Best wishes,
Vicky
Hi Vicky,
OK there may be some confusion here. I work with protein small molecule ligand interactions. I can see how to add the concentrations of the ligand but I cannot see where to add the protein concentration.
thanks,
Ken
Hi Ken,
think there is a slight confusion at our end as to what equation is being used here. Will investigate and get back to you.
Vicky
Hi Ken,
it looks like the only equation we currently have implemented is not the one from Williamson (2013), but based on a more simple one-site binding model:
y = Bmax*x/(Kd + x)
where Bmax is the maximum binding. Hence the protein concentration isn`t used.
See https://www.graphpad.com/guides/prism/8/...ecific.htm for an example.
We will be implementing other equations in future (indeed at some point even a system so you can specify your own equation). In the mean time if you want to do a different kind of fitting you will have to export the data to another programme.
See https://www.ccpn.ac.uk/manual/v3/WorkingWithTables.html for details on exporting tables and also editing the columns shown etc.
Best wishes,
Vicky
Hi Vicky,
thanks for getting to the bottom of this. I hope you can get the Williamson equation implemented soon as that is the most accurate and relevant.
Any luck in getting the H and N weighting issue sorted?
thanks,
Ken
Hi Ken,
it`s on the update server now!
All the best,
Vicky
Hi Vicky,
I got the update thanks. The CSP values are not matching what I am getting from 2.5. The Nitrogen dimension does not look right. Still seems to be too high.
I am having big problems with CSP fits as it does not seem to recognise my reference spectrum even though it puts it at 0 mM. I could email you some screen shots, or is there a way to add attachments in the forum?
thanks,
Ken
Hi,
Is it still the case that Kd is calculated from y = Bmax*x/(Kd + x) as mentioned above, or is there now a way to input the protein concentration and use the Williamson equation? If so, where can I input protein concentration?
Many thanks,
Kate