Dear all,
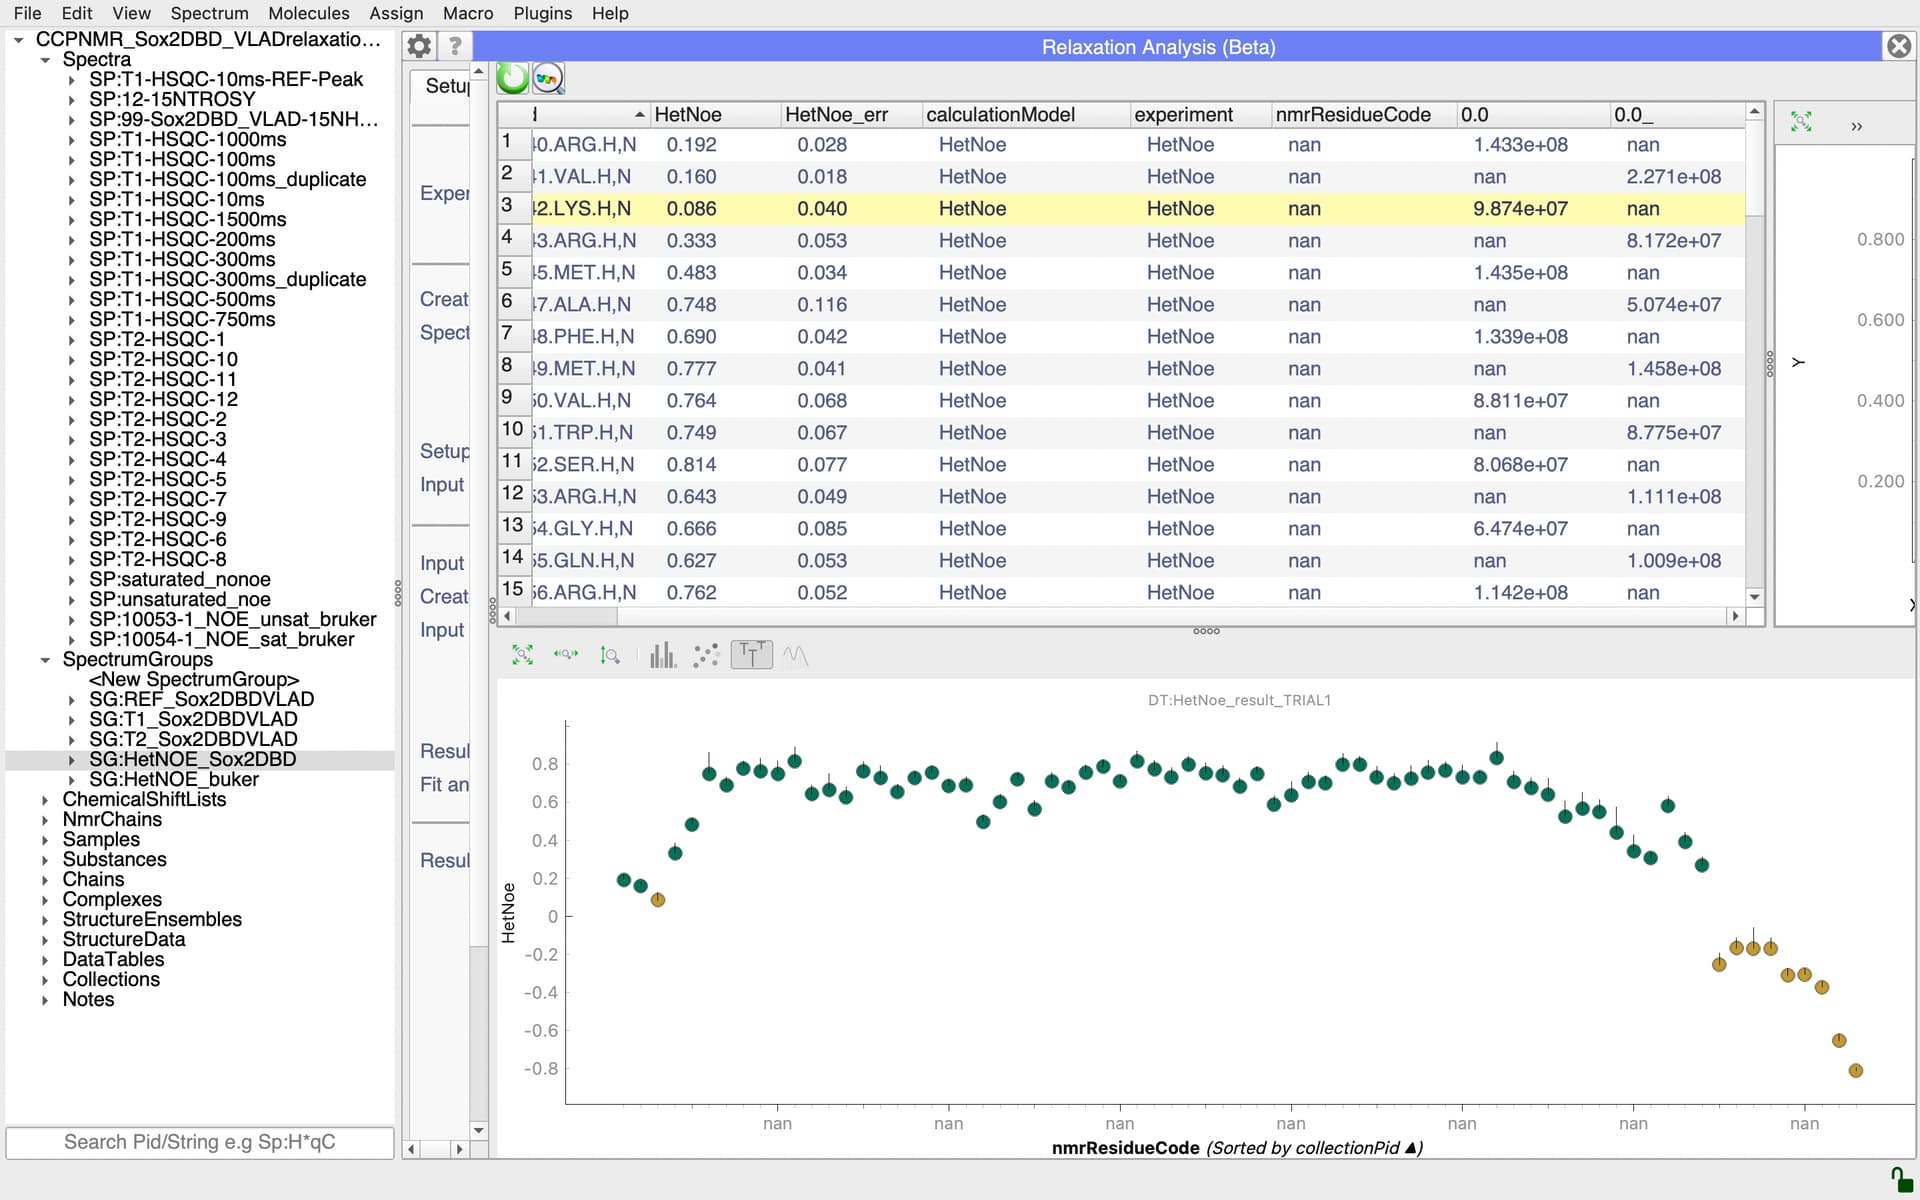
I am currently using the dynamics analysis package, and I am facing a problem with HetNOE calculation in the 3.2.1 version. For the T1, T2 and R2/R1 I don’t get any errors, but when I move to HetNOE analysis, I can make the plot, but the nmrRESIDUEcode is displayed as “nan”, and also the two spectra are wrongly defined (because I defined them properly in the input group as AU sat: 1.0 and unsat: 0.0). I am asking that because apparently I cannot calculate the spectral density function and I think that the problem is somewhere in this analysis. I also wondered if the peak list naming is correct because I did not define a chain (but I left @-). Can you help me ?
Thank you very much
Andrea
Hi Andrea,
we’ll look into this.
In the meantime, could you make sure you have all the updates installed (there could be a chance this is a bug we have already fixed).
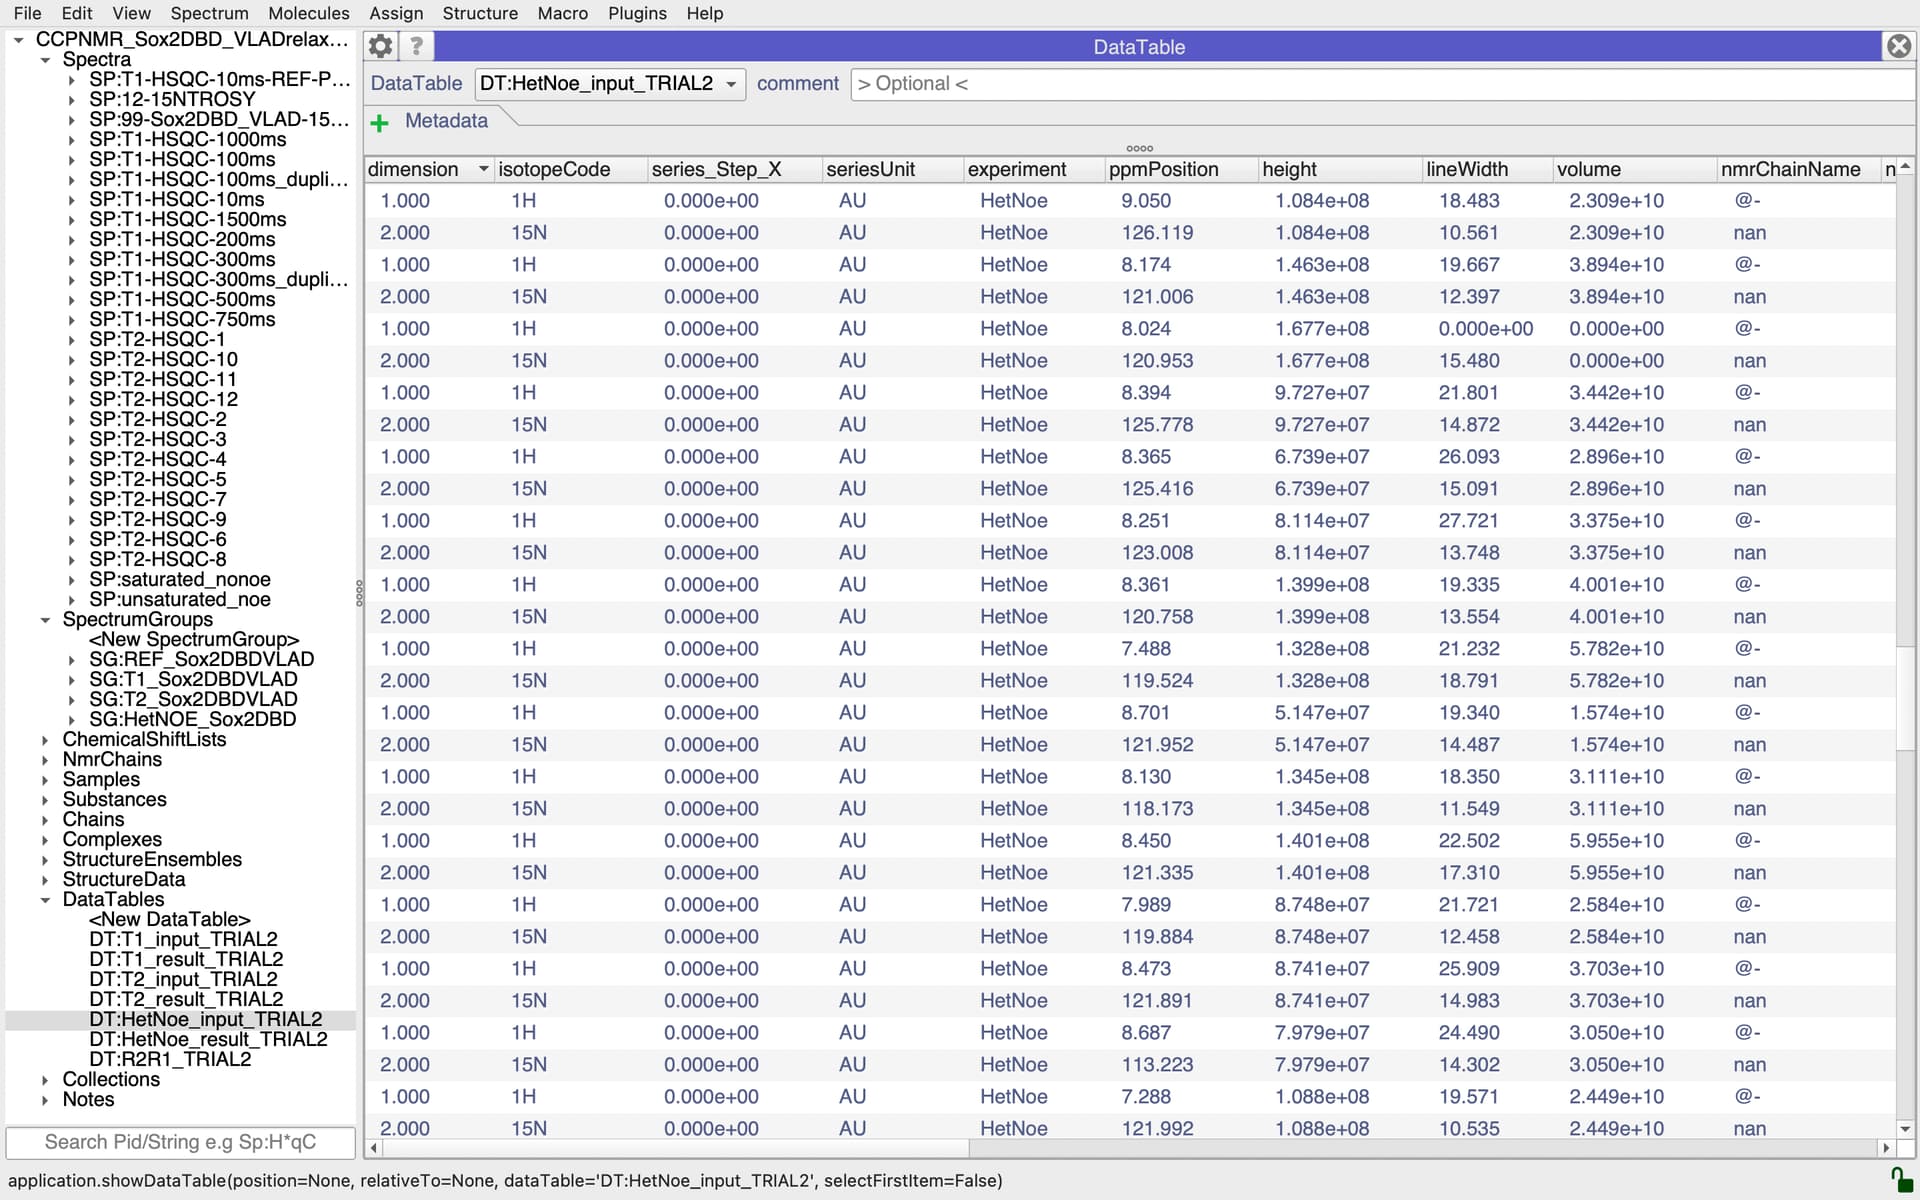
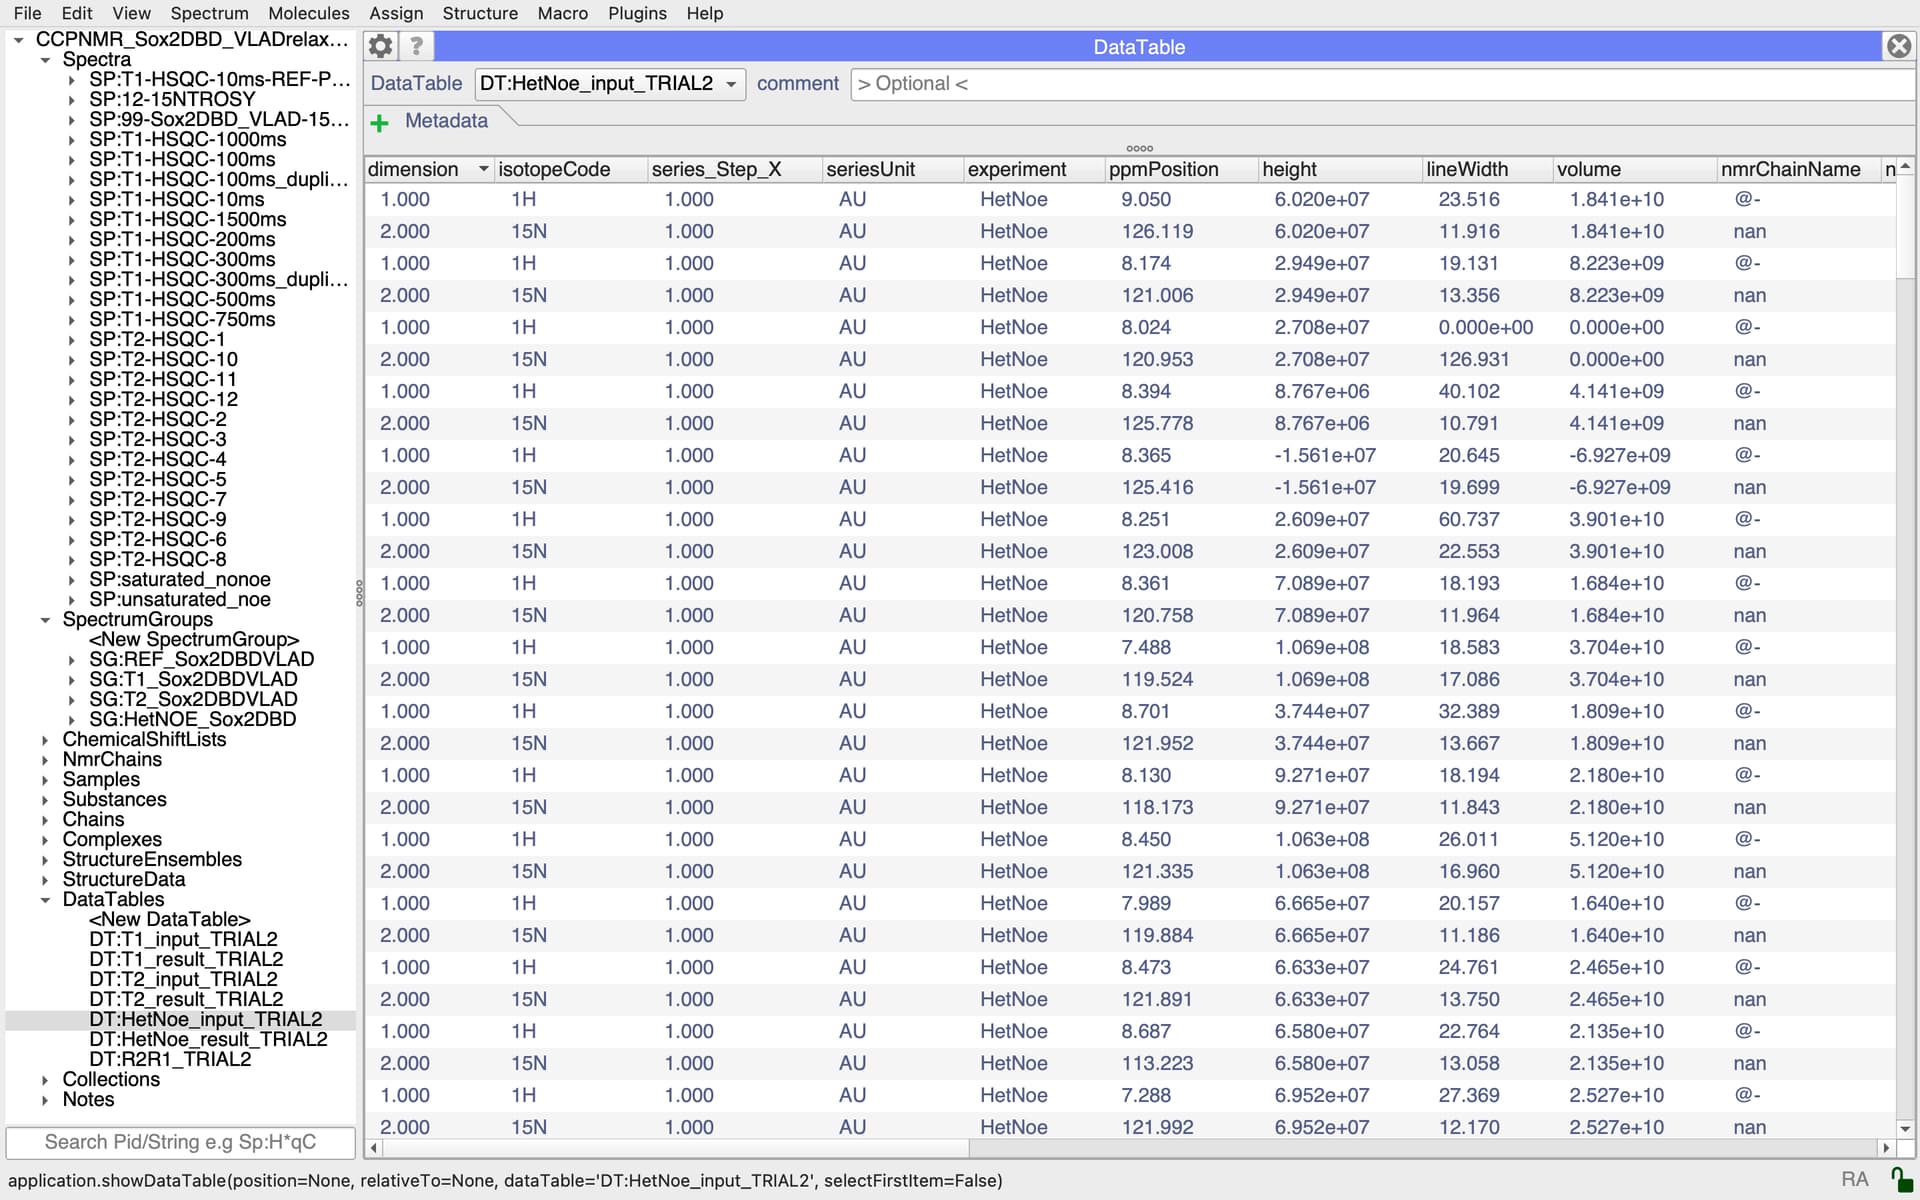
You might also find that looking at your DataTables helps. So in the DataTables section of the sidebar you will see all the input and output tables for the hetNOE analysis and if you drag those into the DropAread, they might give you a hint as to whether there is something odd about the data (perhaps somewhere the wrong thing was selected?).
Vicky
Dear Vicky,
Thanks a lot for your reply, I gave a look to the input files but they seem fine to me… maybe I am not grasping the error. I uploaded a couple of screenshoots for the saturated and unsaturated selection. Thanks a lot
Andrea
Hi Andrea,
it looks to me as though there is an issue with your assignments. In particular, I wonder if your nitrogen atoms are correctly assigned. If you look at the nmrChainName column in your DataTables, you have @- for all your 1Hs and nan for all your 15Ns. I’m not quite sure where the ResidueCode for the graph is taken from, but it is presumably either taking the 15N assignment which might not be present, hence all the nan’s on your graph, or it could be that if there is a conflict between the 1H and 15N assignment, it doesn’t show either. I would have to check in the code exactly what the behaviour is. But I suspect that is place where things are going wrong for you. So check your assignments and make sure that the 1H and 15N dimensions of your peak are assigned to the same residue. You’ll then need to do the analysis again, i.e. recreate the InputCollection and DataTables etc. Hopefully that should sort you out.
Vicky
Thanks a lot Vicky! Weirdly this settings is also for the T1 and T2, but I can extract a graph and also calculate the rates. Anyway I will try to manually change the peak list input
Hi Andrea,
@LucaM had confirmed that it is the 15N assignment that is used along the x-axis.
If the HSQC spectrum which you are using as your reference to create your Input Collections and transfer the peaks and peak assignments to the other spectra, only has the H’s assigned, but not the N’s, then you could transfer the assignments in bulk like this:
- Open the python console by pressing the space bar twice
- Select a peak in the reference HSQC
- Copy and past the code below into the lower part of the python console and press Enter
for pk in current.peak.peakList.peaks:
    nah = pk.assignments[0][0]
    nan = nah.nmrResidue.fetchNmrAtom(name = 'N')
    pk.assignDimension('N', nan)
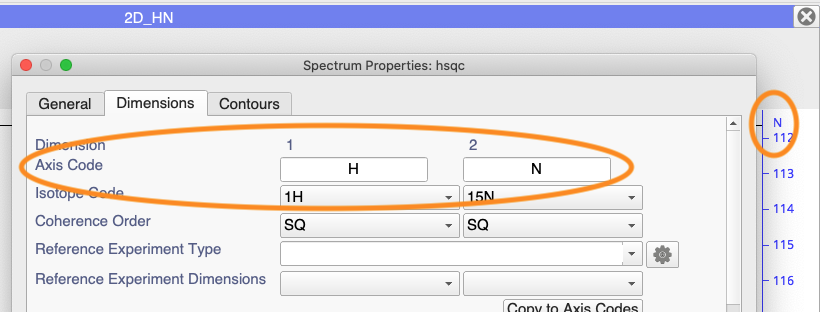
If it doesn’t work, you may need to check the spectrum’s Axis Code. You can see this either at the top of your Axis or in the Spectrum Properties:
If this is not ‘N’, as in this example, then you will have to change the last line of the code to
pk.assignDimension('WhateverYourAxisCodeIs', nan)
Then recreate the Input Collections and hopefully you will see your residueCodes.
Vicky
Dear Vicky,
You solved my problem! It works perferctly now, was indeed an atom name issue. I really thank you!
Greeting from Utrecht
Andrea
1 Like
Dear Vicky,
I apologise if I am writing here again, but I am struggling with the NOE again with another batch of experiments. Apparently the errors are not computed. Do you have any clue what could be the issue? I am attaching the screenshot of the current batch of experiments where I cannot compute the errors. Moreover also with previous data where I could extract the spectra density function, the spectral density mapping does not work at the end, and does not return any graph, do you know why?
Thank you very much
Hi Andrea,
@LucaM might be a better to person to comment on the errors issue, but I suspect for the Heteronuclear NOE this will be based on signal to noise levels of your peaks which means you need to make sure that your spectra have a noise level set. Take a look at your peak lists to see whether the S/N for the peaks is present in the lists or not.
We did recently make changes to the way in which the noise is estimated. In particular, I think we used to set a rough noise level when opening spectra (full estimation would slow things down too much), but have now decided it is better not to do that and for the user to do a proper estimation explicitly and the way they want to do it. Essentially you can estimate the noise level of a spectrum by right-clicking on it and selecting Estimate Noise or using shortcut EN.
See our new set of information on Signal / Noise for more details.
It’s hard to know why the spectral density mapping isn’t working without seeing the project. If you like, then do send it to us as support@ccpn.ac.uk and we can take a look.
Vicky
Thank you very much for your kind reply. I will try to do as you suggested. I sent both files to support@ccpn.ac.uk where I am encountering these issues. I hope you can disentangle the problem
Thanks again :)
Andrea