I’m new to using CcpNmr Analysis and this is my first time posting on the forum.
I am trying to display peaks on an HSQC spectrum using a chemical shift list from a NEF file. I have successfully imported the NEF file, and I can see that the chemical shift list has been loaded into the project.
However, I am unable to see the corresponding peaks plotted on my HSQC spectrum. I’m not sure what steps are needed after the import to make the peak information appear on the spectrum display.
Could someone please advise me on the correct procedure to plot the data from an imported chemical shift list onto an existing HSQC spectrum?
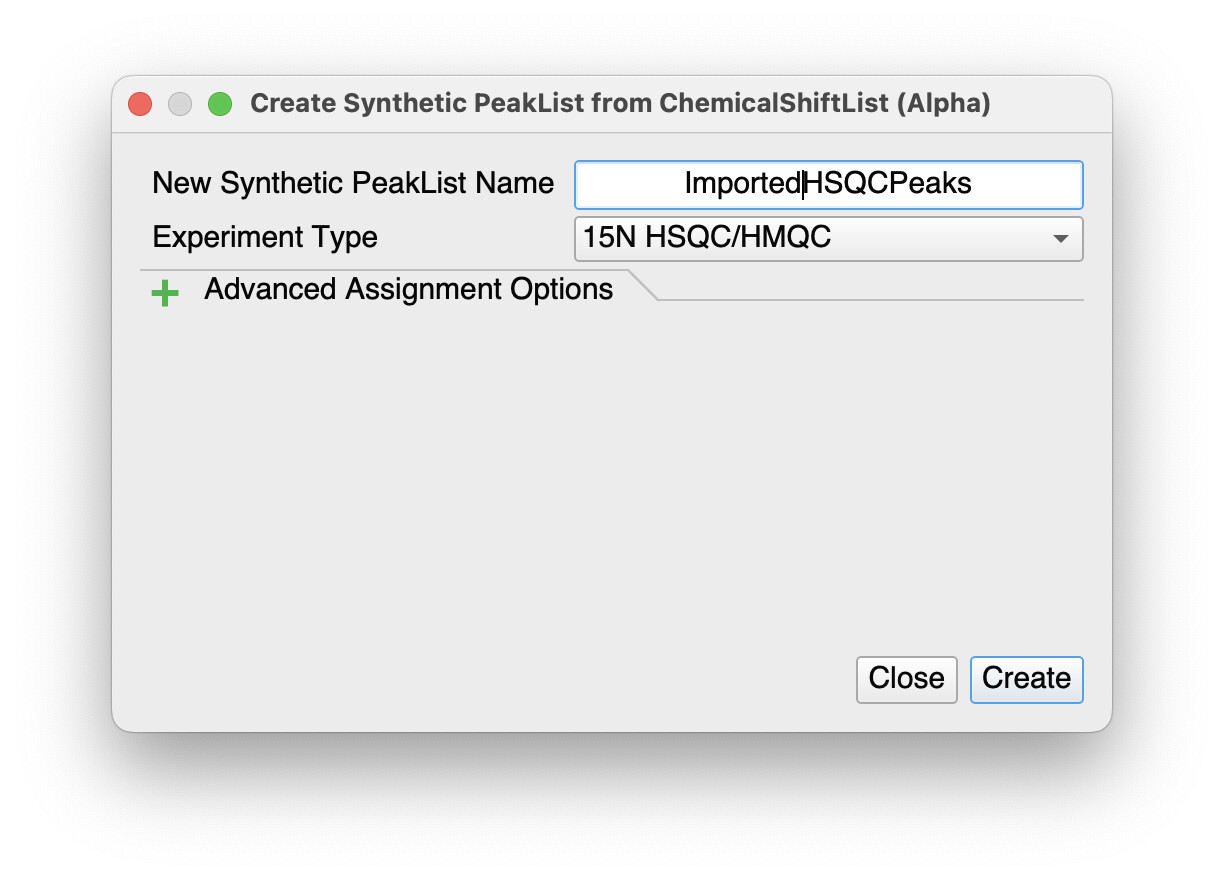
simply right-click on to the Chemical Shift List in the sidebar and select Create Synthetic Peak List. Then select 15N HSQC/HMQC as your Experiment Type and you may also wish to change the New Synthetic PeakList Name to something like ImportedHSQCPeaks. Then click on Create.
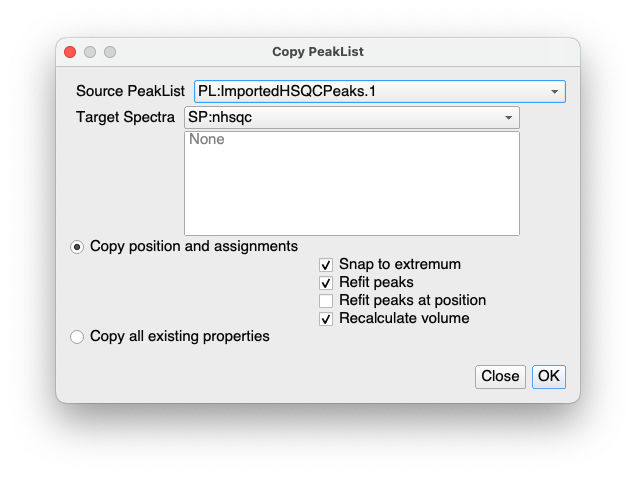
This will create a new Spectrum (called ImportedHSQCPeaks) in the sidebar. Then copy that peakList over to the HSQC spectrum you have either by dragging the peakList from the sidebar onto the spectrum in a SpectrumDisplay in the DropArea, or simply with Spectrum / Copy PeakList… or shortcut CL. This will bring up another pop-up. Make sure the correct PeakList and spectrum are selected at the top and then decide whether you want to refit the peaks or simply copy them exactly as they are and click OK.
I sincerely apologize for my late reply.
Thanks to the method you kindly suggested, I was able to display the peak information on the HSQC spectrum successfully.
Thank you very much for your support and guidance.