Recently I’m dealing with INADEQUATE spectra and have a small request and some questions:
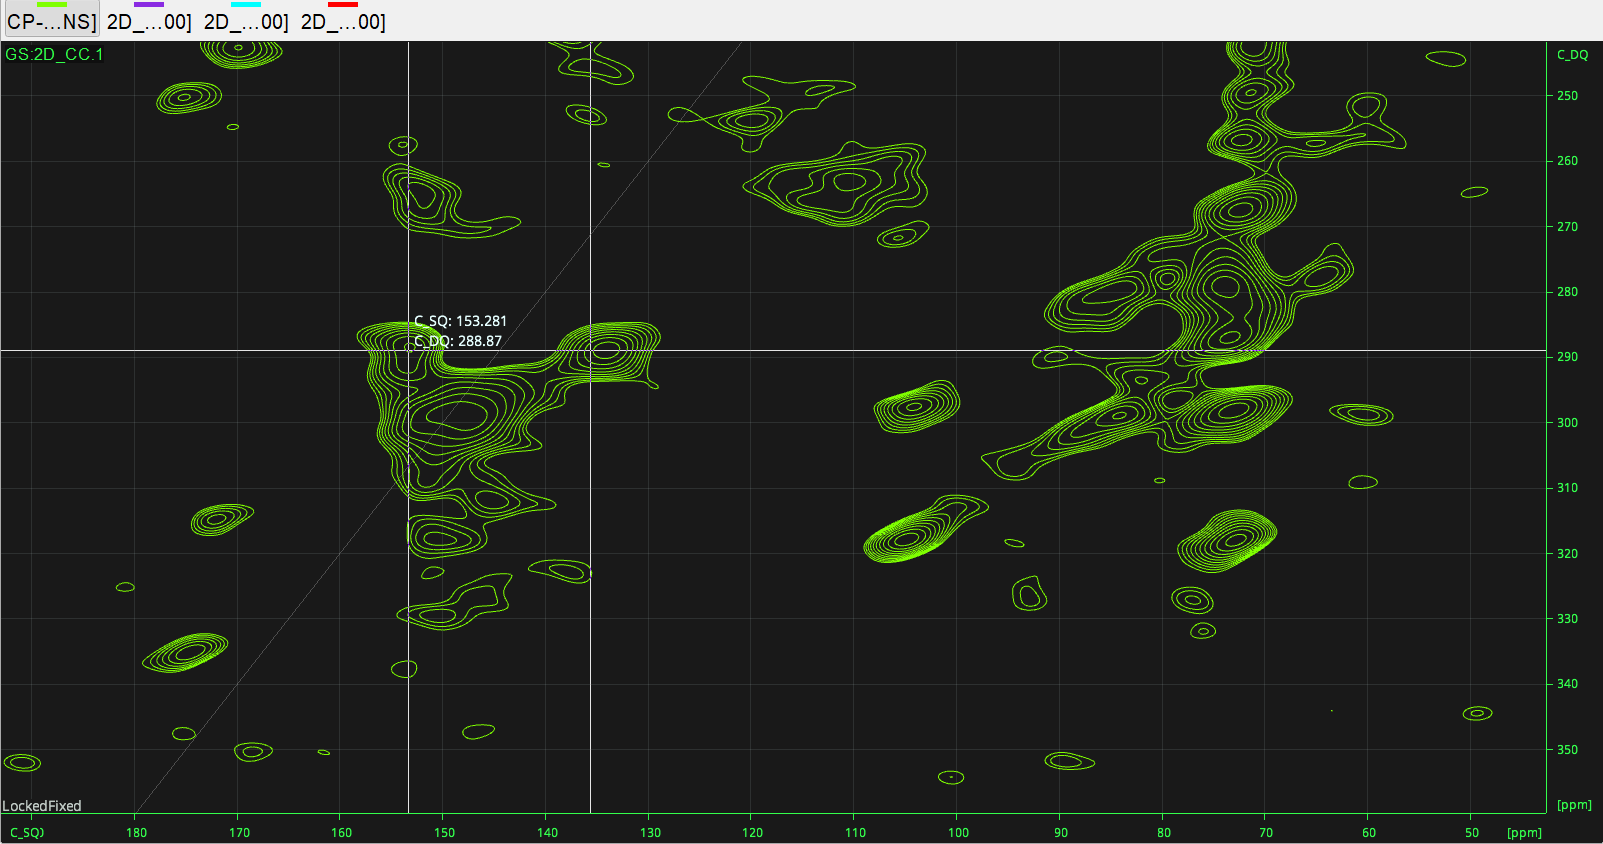
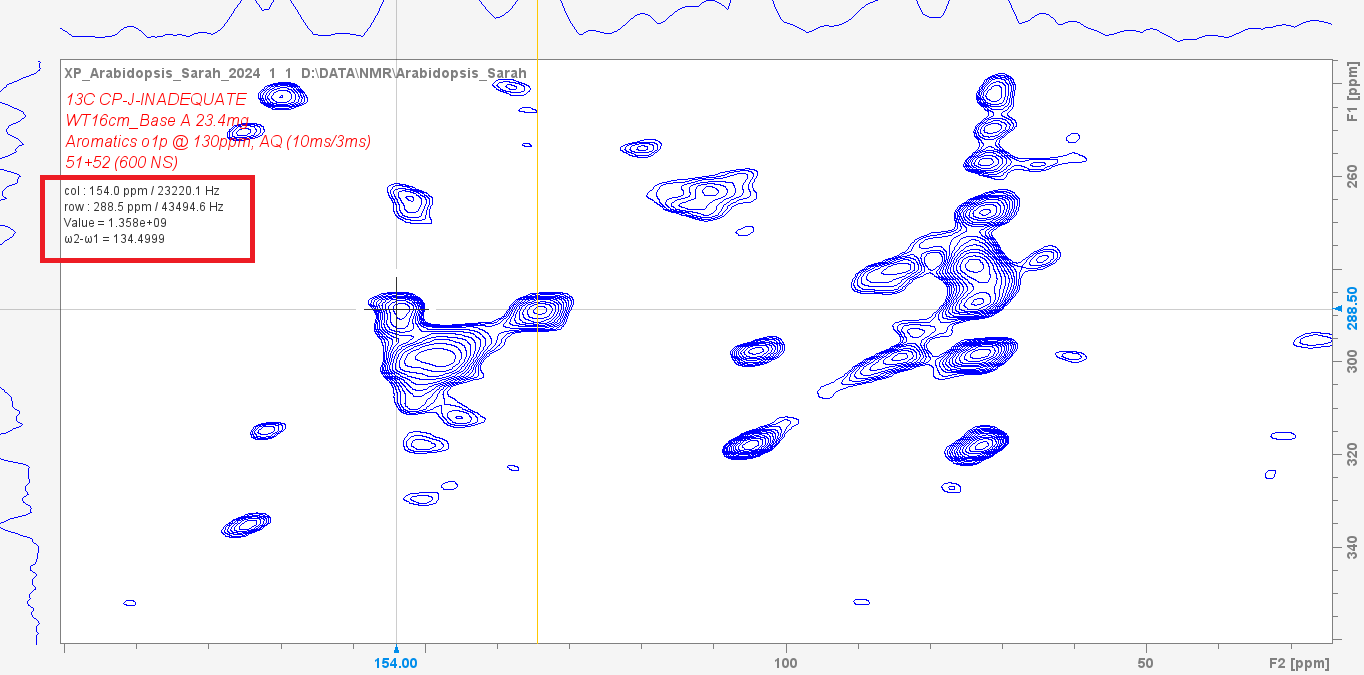
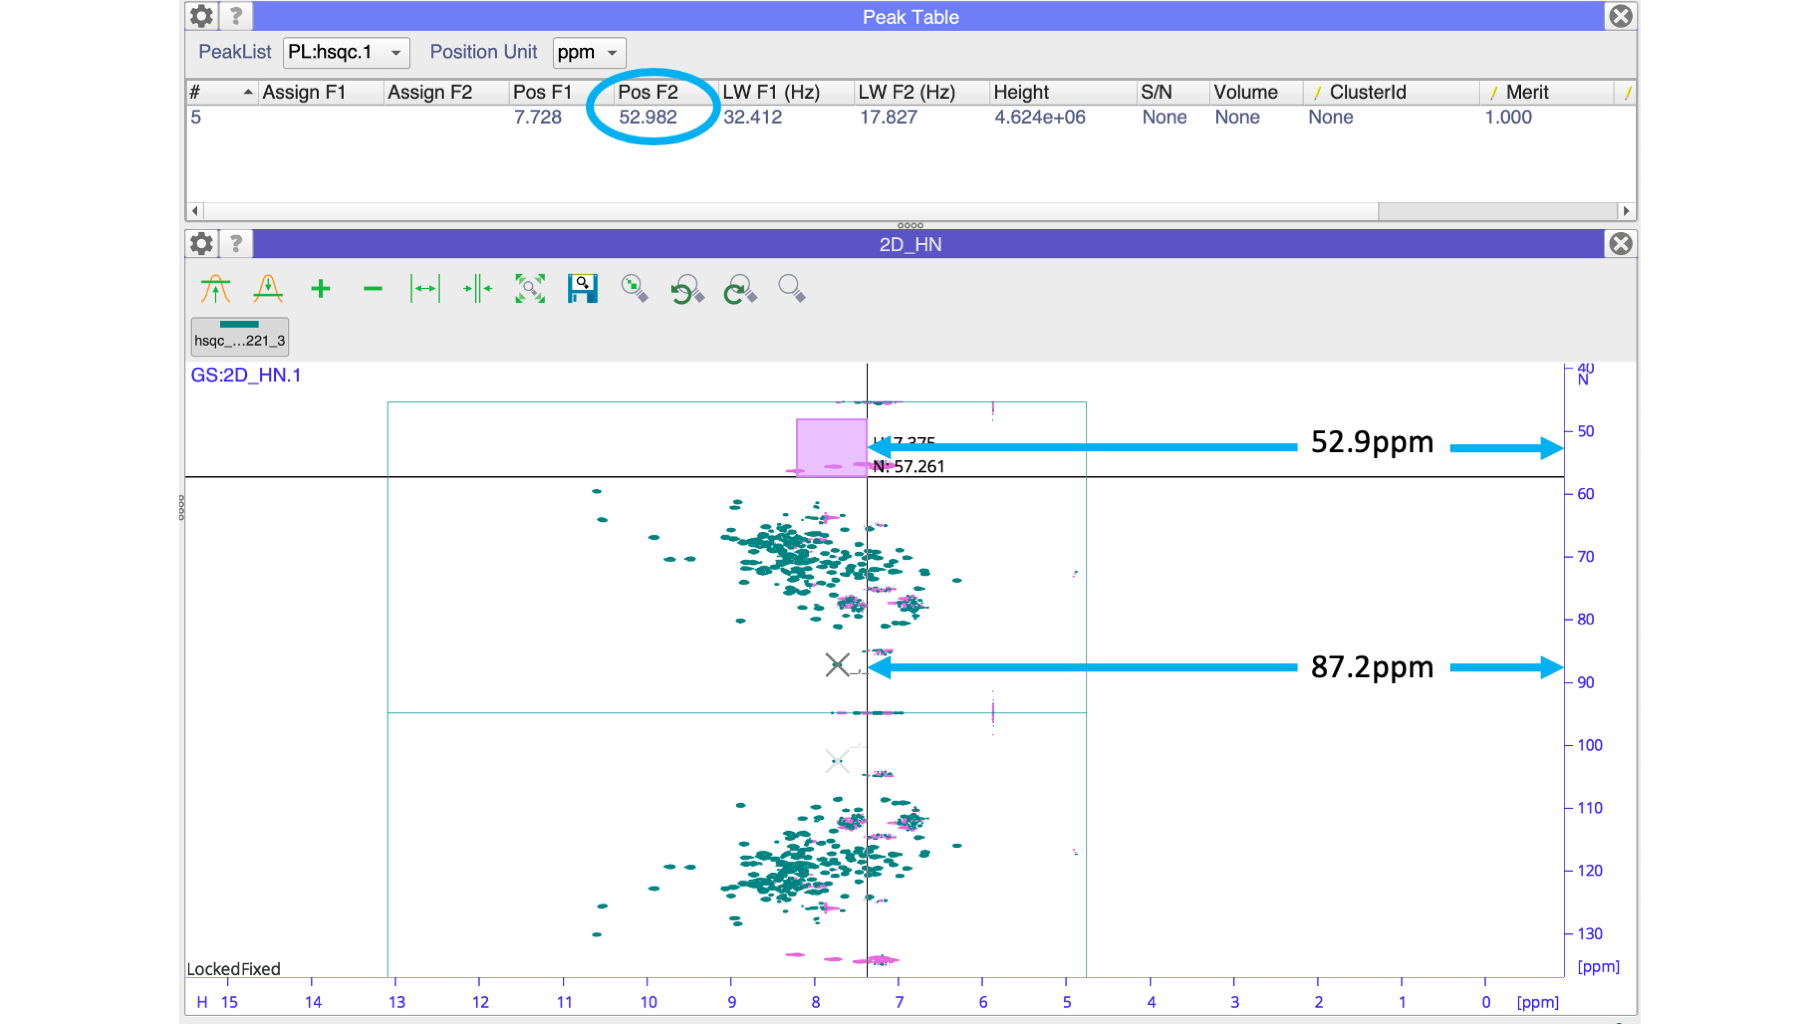
After selecting the DQ/SQ in the Property/Dimensions, the mouse cursors can navigate to the paired peaks and displays the SQ/DQ values. Is it possible to also display the calculated ω2-ω1 values along with DQ values, like that the INADEQUATE mode in Topspin, so that I can directly tell the SQ chemical shifts of the pair without calculating them one by one myself? (I didn’t find the INADEQUATE spectrum type option in the property so not sure if this function is implemented already). Here are the screenshots to illustrate what I’m trying show:
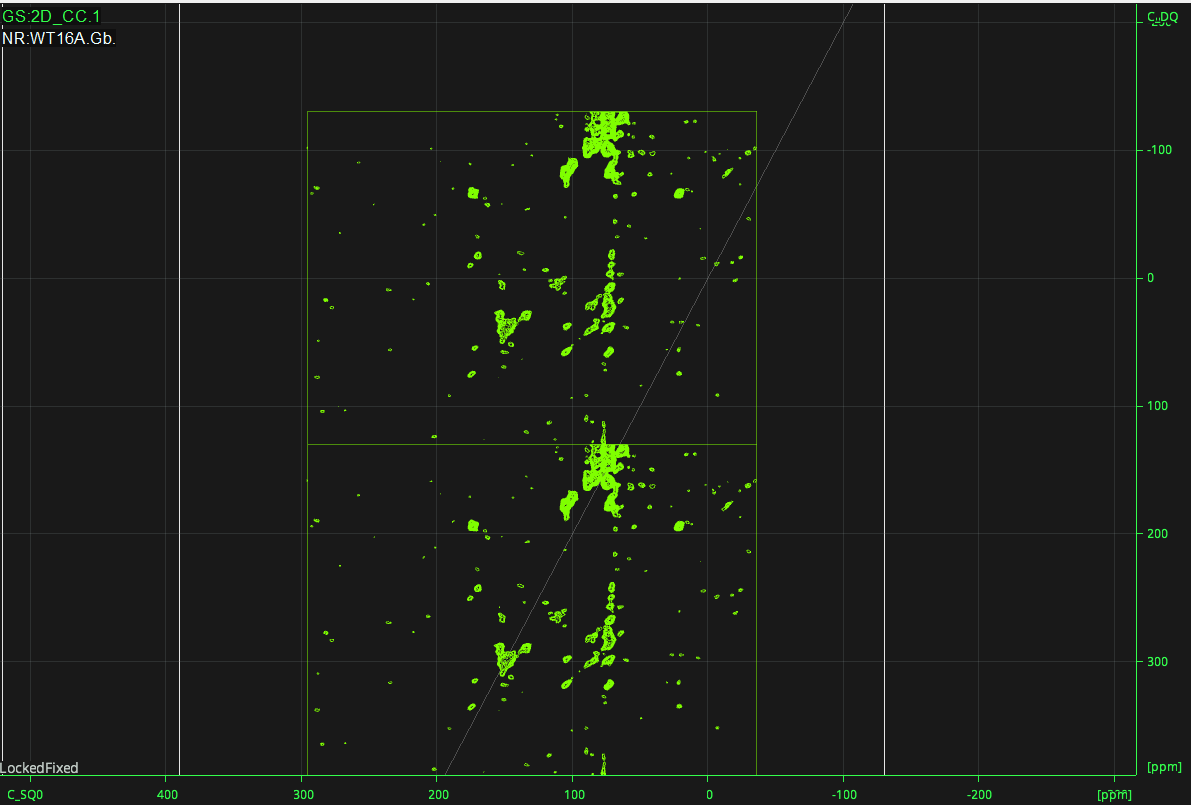
Another question is, I suspect there are some spectrum fold in the INADEQUATE, and it is quite hard to distinguish and back calculate the folded part. Is there a way to “unfold” the spectrum (simply mirror and duplicate half with respect to certain plane/border-line) so it is easier to check those peaks and peak position with the INADEQUATE axes and chemical shift values?
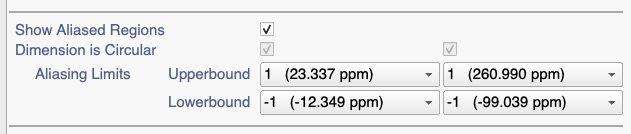
If you want to change the aliasing of a peak (i.e. move it from one “folded” region of the spectrum to another, then select it, right-click and go to Set Aliasing…
On top of the mouse cursor implementation: it would be also great to add an toggle option for the INADEQUATE type, so that when peak picking (MM) the first peak, the corresponding paired peak is also picked and marked (since the crosshairs for both positions are there already, I think this shouldn’t be too complicated?).
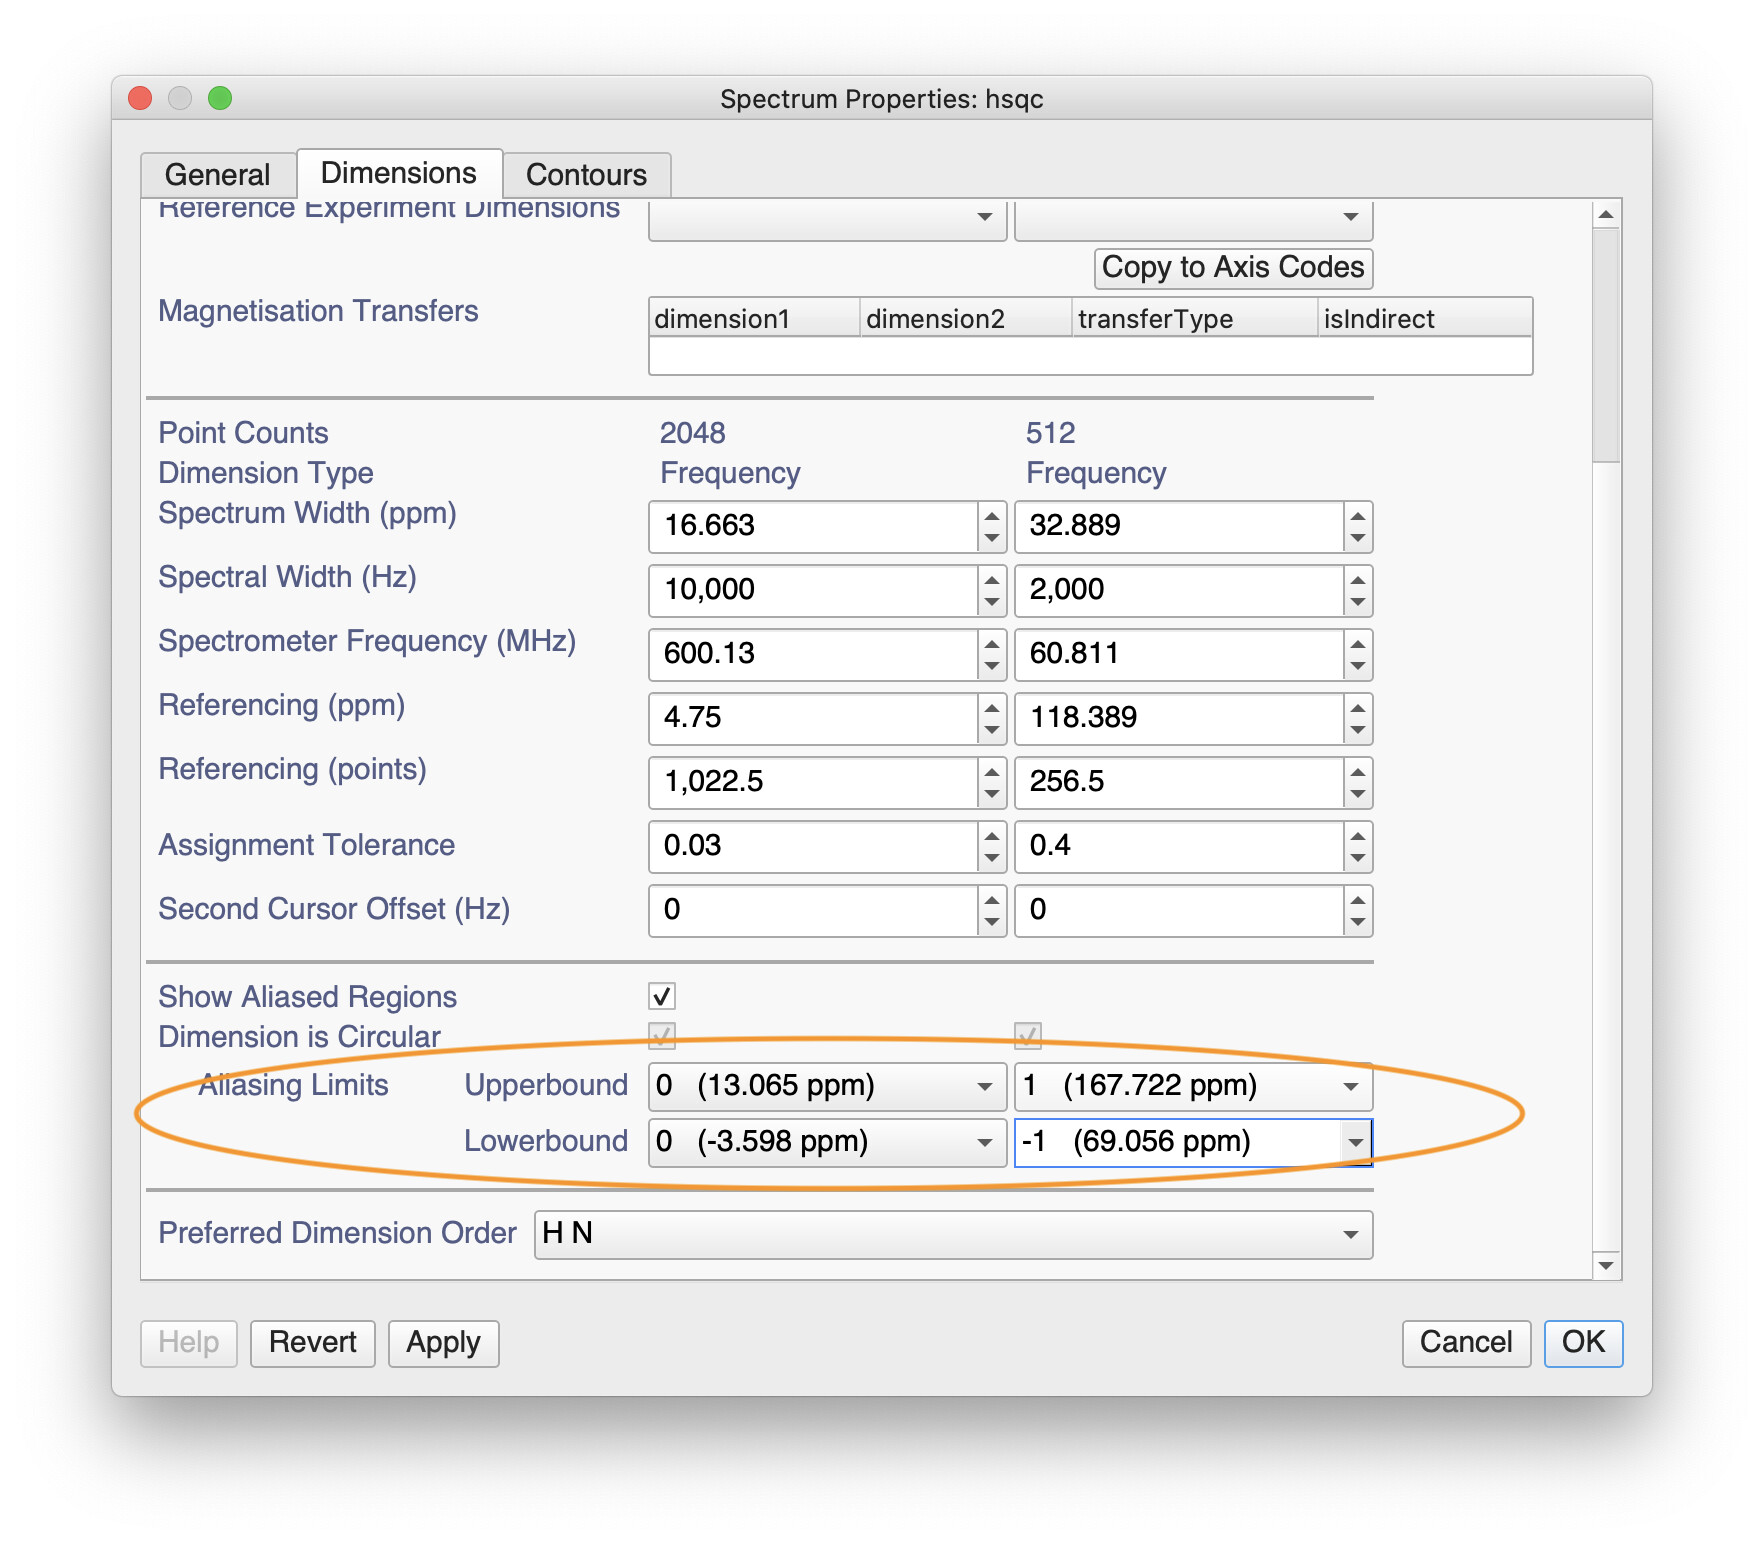
I thought you could switch between mirrored or circular aliasing when setting the aliasing in Spectrum Properties, but I see that the tick box has been greyed out:
I’ll check what is going on here and get back to you.
I’m just wondering if there is or will be some updates regarding the INADEQUATE mode, i.e. implementing the function to display the calculated ω2-ω1 values along with DQ values and pick the peaks as pairs (as I elaborated in the first post).
I’m trying to introduce CCPN to the lab mates and we will be analyzing a series of INADEQUATE spectra. It will be great to receive this update or have an idea of the future update plan, thank you!
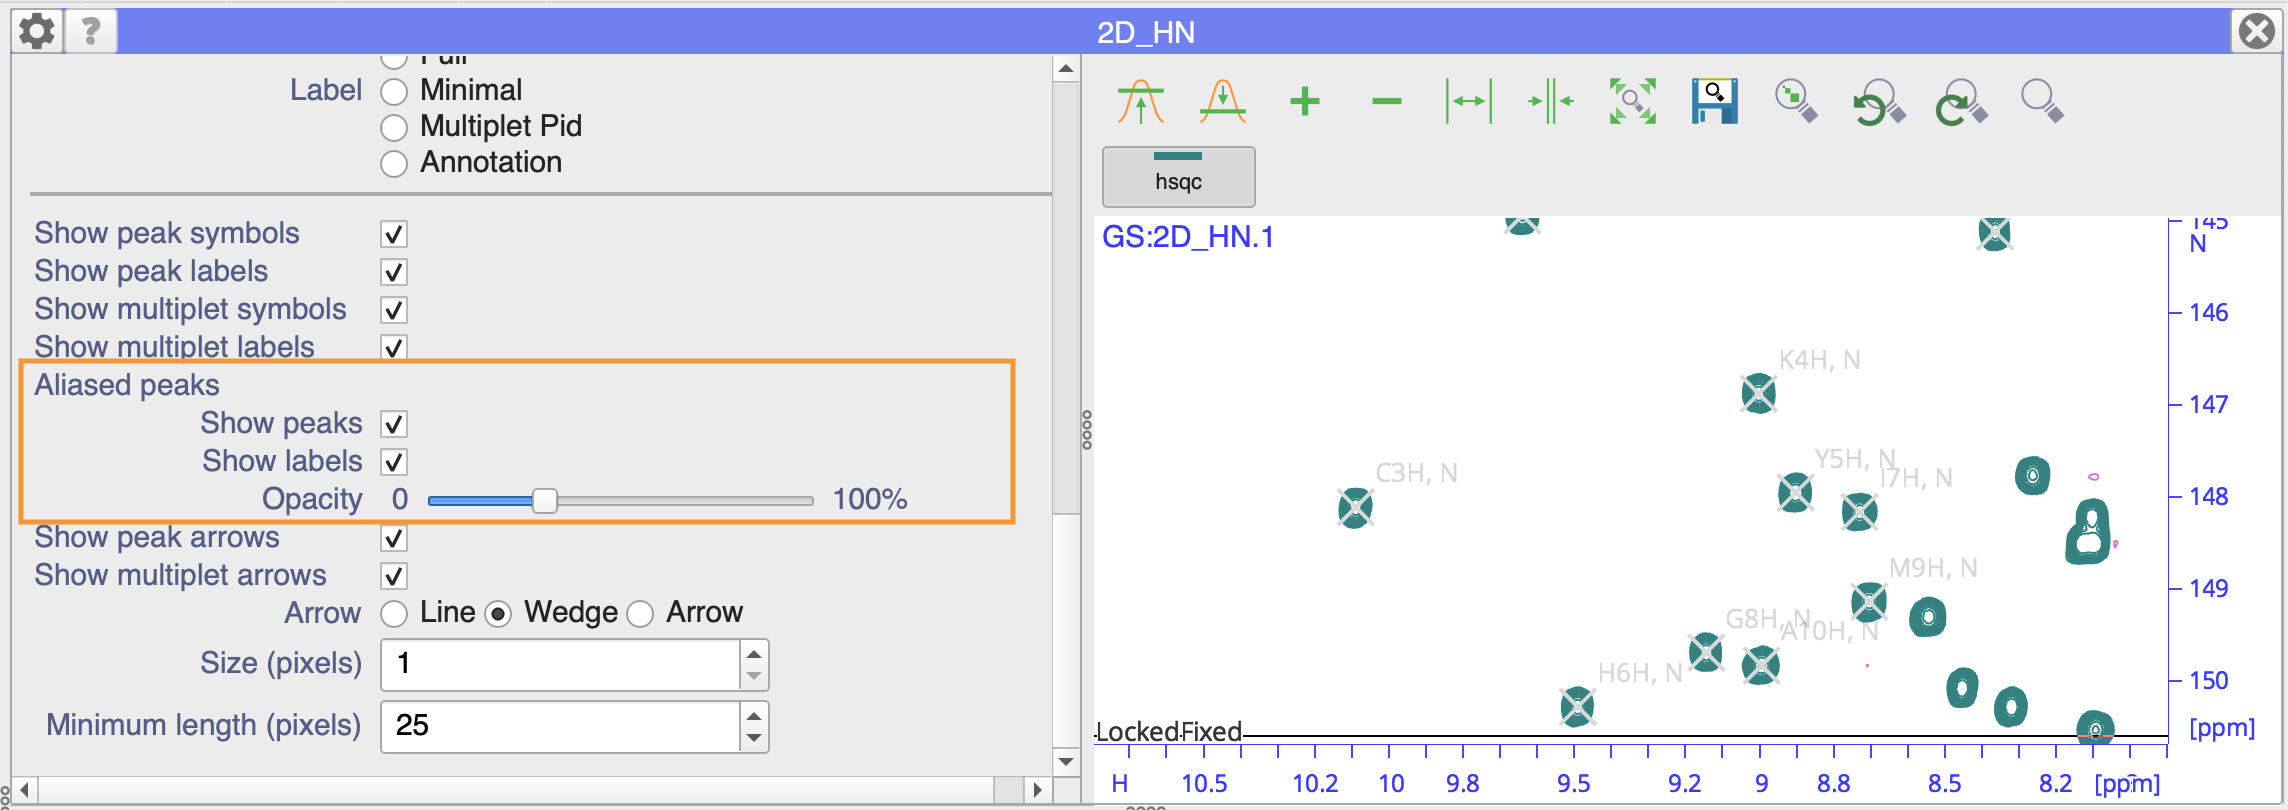
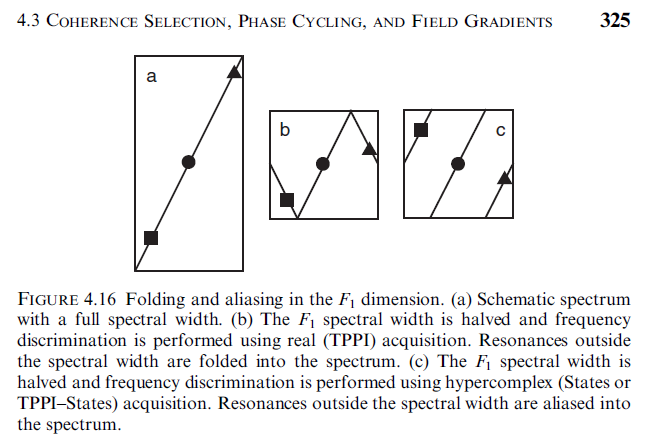
the problem with this is that we can in principle allow the spectrum to be mirrored and that is how it will be shown. However, the handling of peaks in this situation will be all wrong.
You will be able to see the Spectrum mirrored.
You will be able to pick peaks in the main part of the Spectrum and then change their aliasing and you will see them on the mirrored part.
However: the peak position in the PeakTable will be as it if the aliasing were circular, not mirrored.
Also: if you want to select the peak, you would have to do so by selecting it in the circular, not mirrored, area of the spectrum.
This figure hopefully shows a bit what is going on:
Fixing this is for various reasons quite fiddly an would probably take on the order of days. So we’ll have to see how this fits into our overall priorities.
So it depends a bit on why you want this feature to be enabled and what you want to do with it as to whether it is
a) worth our while enabling this feature again
b) worth our time fixing the peak issues.
Sorry for misunderstanding, I didn’t mean the spectrum folding/aliasing issue - this part can wait for future updates.
I meant adding the ω2-ω1 value display on the second crosshair. Currently in INADEQUATE spectrum there are two crosshairs, the one that moves with the mouse shows SQ and DQ values at the mouse position and the “paired” crosshair that moves along with the first crosshair doesn’t show anything. The SQ value (ω2-ω1) for the second crosshair can be calculated manually, but it will be great to implement a simple calculator (see the Topspin screenshot in the early post) and display the SQ/DQ values on the second crosshair as well - this is what I meant.
And for the manual peak picking using MM, currently it will mark a peak only at crosshair on the mouse position, it will be great to be able to simultaneously mark the paired peak at the second crosshair as well (so that I don’t need to use the mouse cursor to manually move around to align and find the paired peak). Here I’m just talking about peak picking in the main spectrum region not the mirrored. It will just make things much easier.
I hope these small features are not too hard to implement!