I am using the chemical shift mapping module to analize titrations. I get a different bar plot when using a spectrum group containing all the titration spectra vs when I use a spectrum group with just 2 of the spectra: the reference spectrum and the last titration point spectrum.
Additionally, the paterns I get when doing the chemical shift perturbation manually in excel (using a different equation) are different to the paterns on the bar plot of this module.
Could someone please help me to figure out what is going on? Thanks in advance!
thank you very much for this reply. I am now getting the same results with the Alpha module.
There is just one issue I am getting with the barplot in the x-axis with the numeration, the side chains are plot in disorder and at the end of the barplot (not plot directly after their corresponding N,H residue) and one of the normal N,H residues is also plot at the end (completely random out of sequence).
The side chains have all the same assign system, in my case: N.HE21, N.HE22, N.HD21, N.HD22
I figure it plots according to their order in the collection, but I cannot reorder the collection (e.g. by dragging the residue). Is there somethig I can do to reorder how the residue numbers are plot?
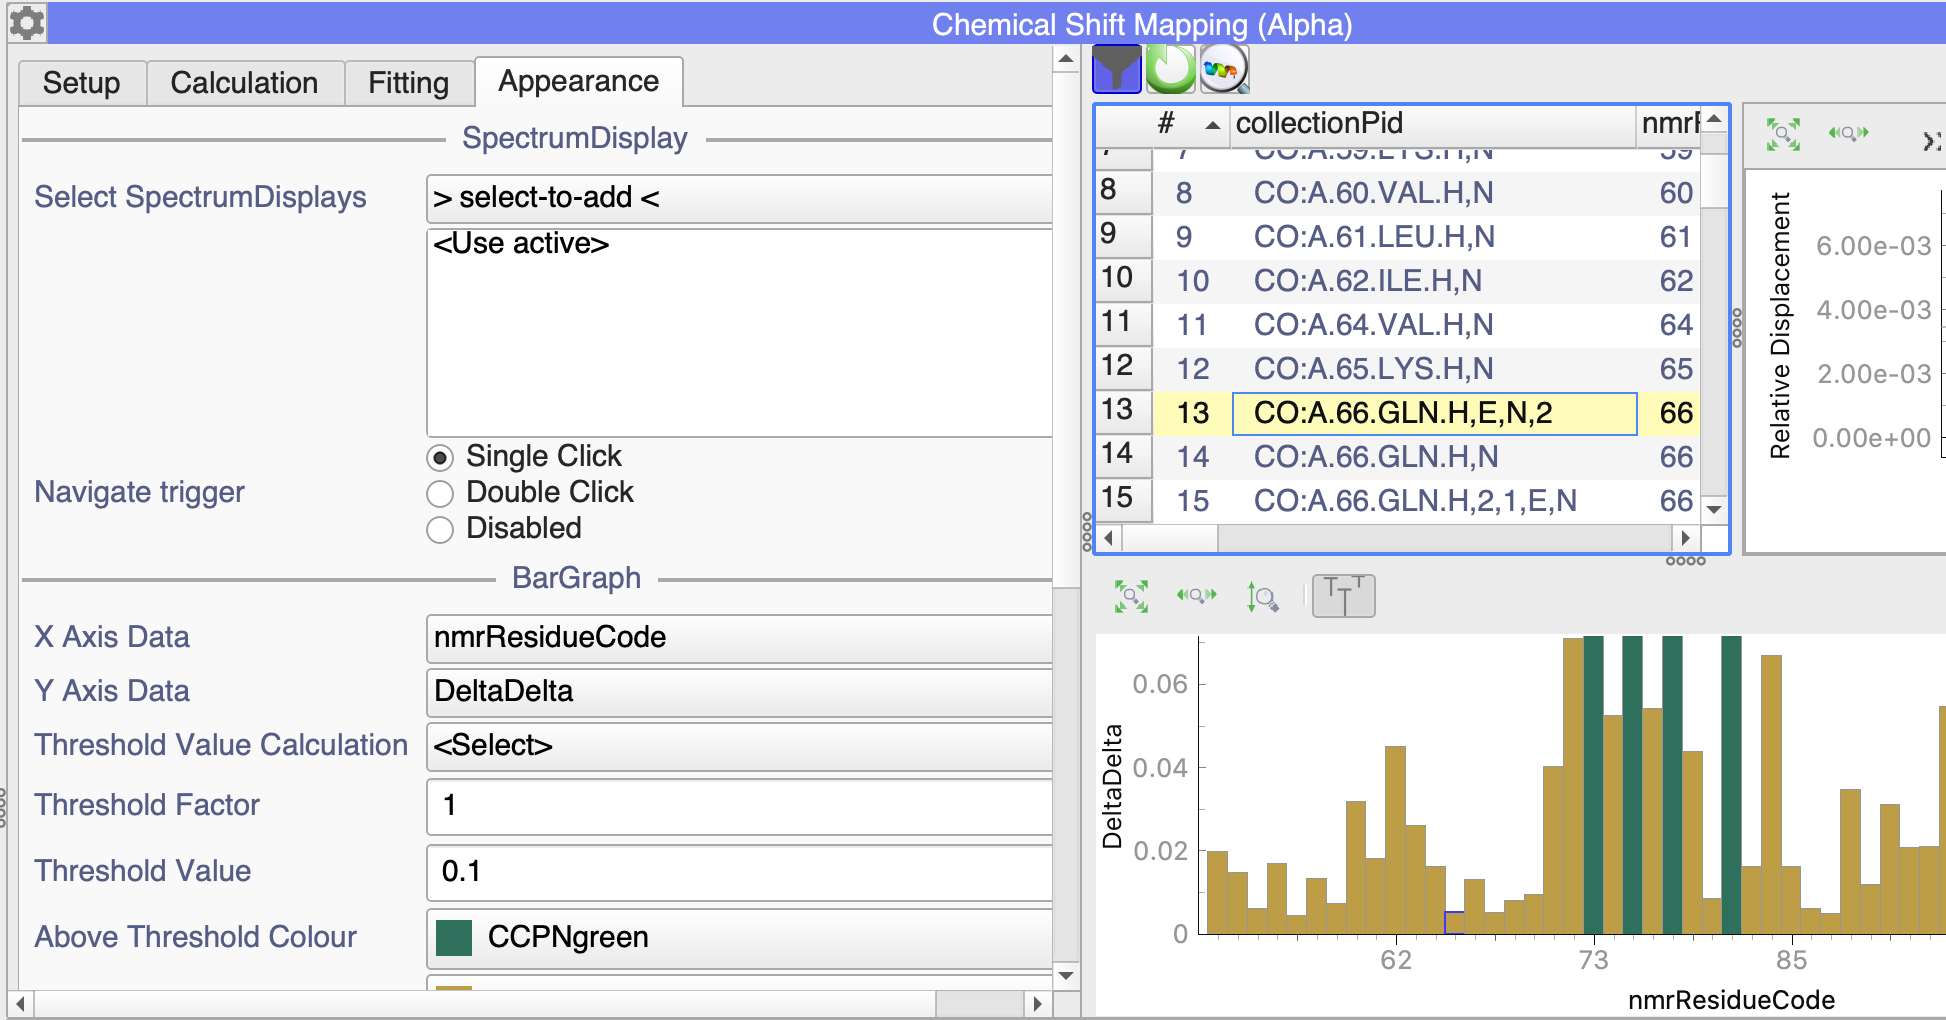
in my case, I am plotting the nmrResidueCode along the x-axis (see the Appearance tab in the Settings) and then the side-chains are in amongst the NHs:
My NmrAtoms are exactly as yours, the problem is when the collection is created the numbering is not in order. I have tried couple of times (sorting my reference peak list in the correct order) but the collection is still created not in order: as I said before, just for one N,H residue and for all the side chains. I can sort the table by nmrResidueCode but this does not update the bar plot.
Adittionally, is there a way to include the unassigned residues in the plot? with the previous module they appeared and one could give them a color and a ‘Disappeared value’.
Thank you very much for your help.
P.S. Watching the video again, the side chain of Q66 also appears at the end in the collection, not in order as you showed me in the above screenshot
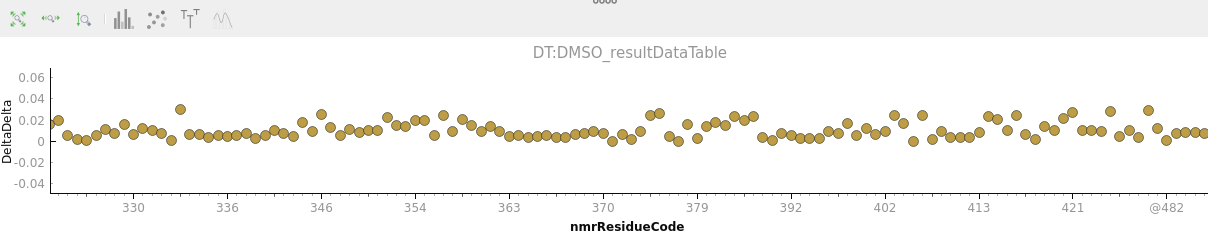
this is probably where the “alpha version” bit comes in. I think for the moment, if you want a bespoke order for your graph (e.g. for publication), then you will have to export the data and do that in the different program. You can export the data either from the table in the Chemical Shift Mapping module, or you can drag the Results DataTable into the DropArea and then export that.
We’ve got plans for all of this, but not had time to implement it all. Part of the problem is that different people will want different things. You may like to see your side-chains alongside the backbone NH, but there is obviously also a case for having a graph of only the backbone NHs and leaving gaps where they are etc. Our plan is that you will be able to switch different groups (e.g. side chain/backbone/methyl etc. on/off, or whether to show disappearing peaks etc. but it isn’t going to be entirely straight forward to code all the different options that people might be interested in.
Thought it might be helpful to add the following information to this thread:
We’ve now got the new Chemical Shift Perturbation Tutorial on our Tutorials page. This uses our new Alpha Chemical Shift Mapping module which is actually more reliable than the old one. It is also more flexible in being able to deal with unassigned residues. In our next release this will be available from the main menu. There are still a few things to iron out with regard to plotting the BarChart (how to handle gaps or a mixture of backbone/side-chain etc.). But that should all improve over the next few months. Some of it may have to wait till the 3.2 release - but probably that won’t be so far off, either.
here I am again. After long I am using again the chemical shift mapping module, this time the beta version in V3.2. The issue I just encountered is that I cannot plot a bar plot anymore, instead I have just the scattered plot. Somehow the plot icons are inactive (except the zoom and error bars icons). I hope you can help me again this time.
Thanks,
Carolina
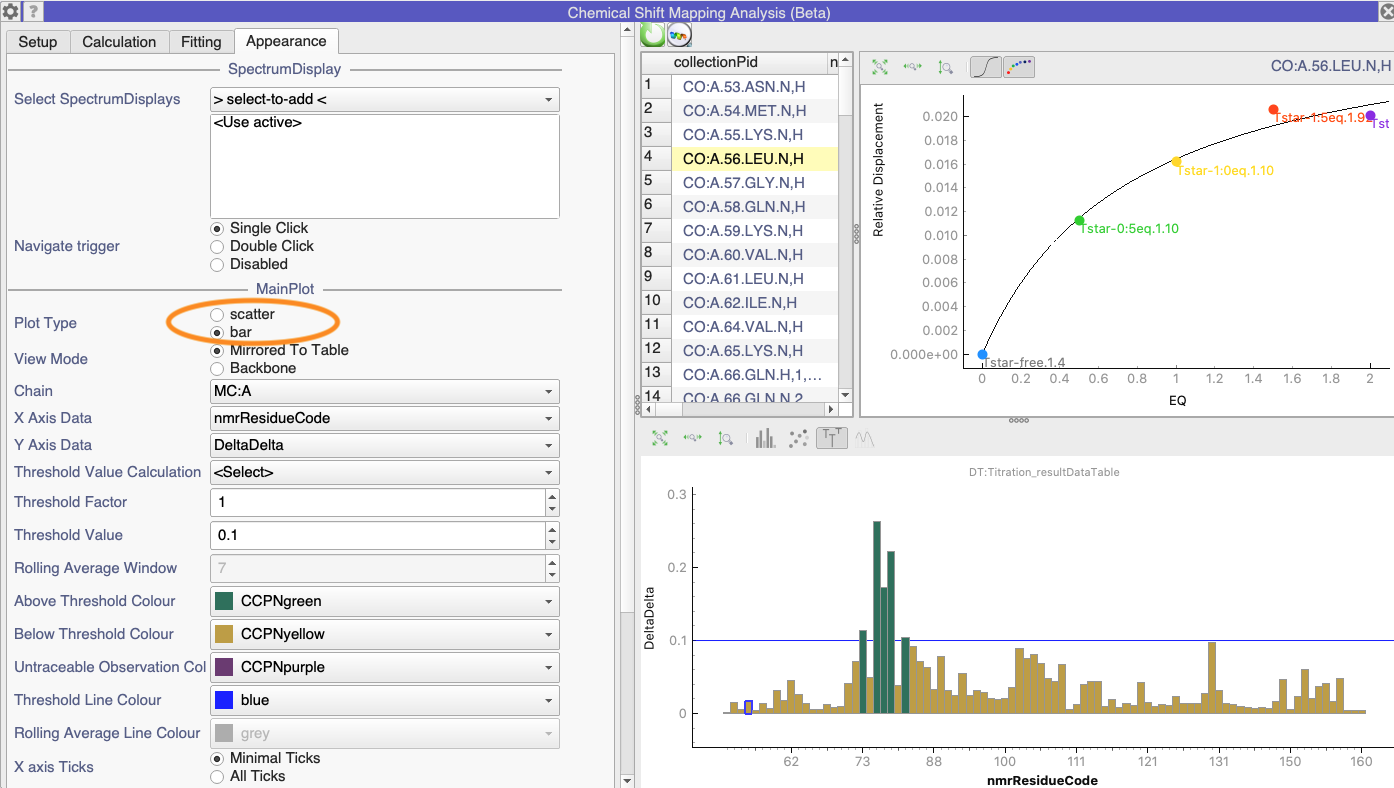
I’m not quite sure why it is currently defaulting to a scatter plot (probably because that is what the Dynamics Module does, @LucaM?). But you can easily change it to a bar chart in the Appearance tab of the Settings:
I still don’t manage to have the full sequence in the x-axis of the plot, i.e. including unassigned (untraceable) residues like it was in the alpha version. Is this supposed to be working in the latest v3.2? Or is to be released?
Also, with the newest updates the molecular viewer function is not working anymore (I run the test in the preferences for the executable path and it said success but didn’t open pymol).
The right click over the graph (to select reset view, threshold line and export) does not work. I don’t know since when because I never actually use it, but it would be usuful to export the graph.
Thanks in advance for your help.
Best wishes,
Carolina
Dear Carolina,
I’m surprised that you can’t see the full sequence along the x-axis.
We implemented two different ways of plotting the data which you can set in the Appearance tab of the Settings. One is Mirrored to Table and the other is Backbone (I think @LucaM spotted a problem with the Backbone version the other day and may have temporarily disabled that - I’ll check with him what is going on there).
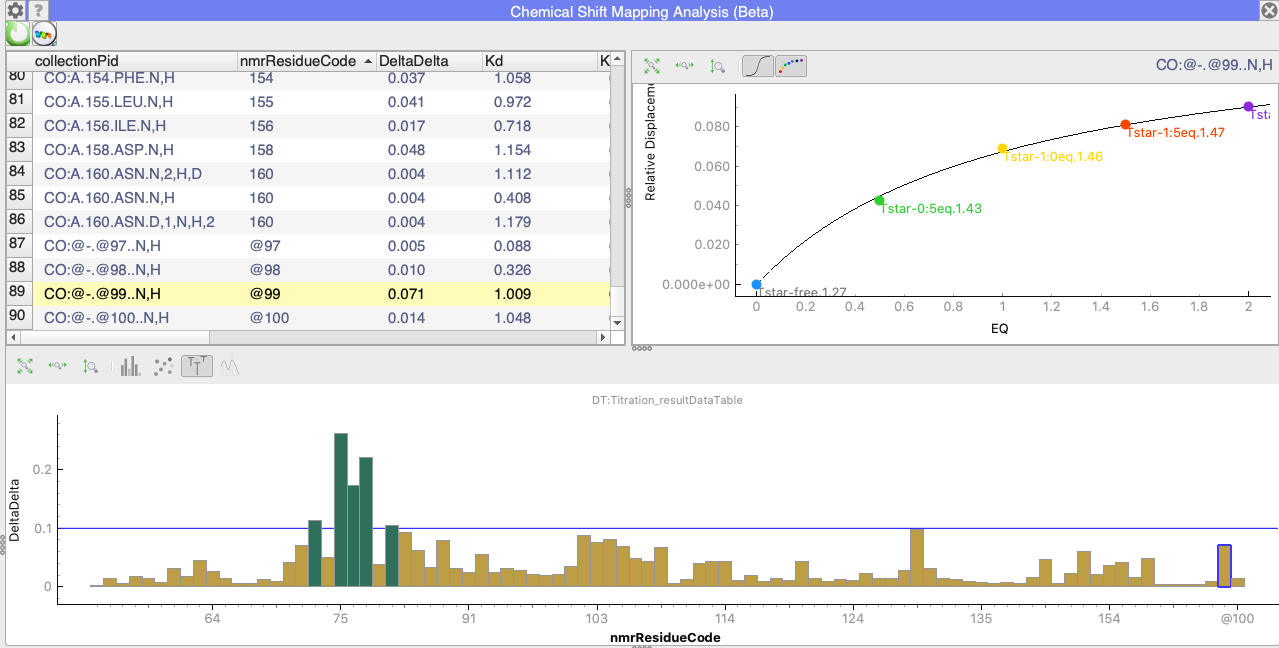
When Mirrored to Table is selected, then the x-axis will show all the values in the Table in the same order as they are in the table. Here is an example:
You can see that the selected data point is for nmrResidue @99, i.e. an unassigned residue. But as not every point is labelled on the X-axis (because I am zoomed out to see the whole axis), this isn’t very obvious.
I’ll have to check about the link to Pymol.
The threshold you should be able to reset in the Appearance tab. There are actually various settings you can select - though I am not quite sure what the default is. @LucaM should know. It’s possibly something like 2.5 times the Standard Deviation (Std)
On the PyMol issue:
What operating system are you using?
I am finding that the PyMol function isn’t quite working as it should: it shows me the PyMol example pdb rather than the one I selected, and it gets the colouring wrong if there are unassigned residues present. So I’ll see if we can get those things fixed. But clearly if it isn’t even opening PyMol for you, then your problem is something different.
Actually what I meant for unassigned residues is for example prolines or other residues that I haven’t been able to assigned, I clean up my sectrum removing all the ‘@’ peaks before doing chemical shift perturbation or relaxation analysis (good to know that they can be included now).
Thanks, the backbone option does what I need at the moment. In this project I don’t have side chains assigned yet, so I guess that would be another issue if one wants them additionally to the backbone numeration.
About the pymol issue: I use Scientific Linux 7.9 which is a derivate of RHEL 7.9