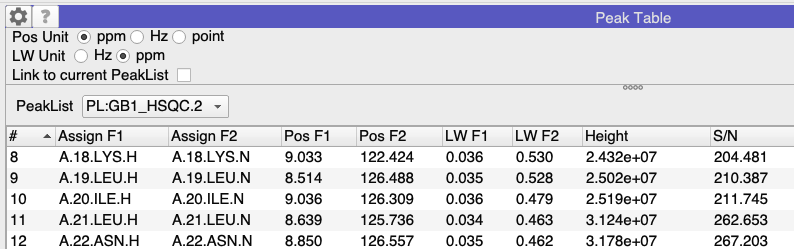
Since a while we realise that the line-width (LWF#) of the peaks for the same experiment are different in version 2 or version 3. In version 2 you can choose the function but not in version 3. But it doesn’t seem to be related to this (see fig.). Which function is used in version 3?
If I manually measure the full width at half height (FWHM) it seems that apparently the LWF# in version 3 underestimates the FWHM.
Is this alright?
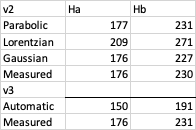
(all data in Hertz)
I think the default in Version 3 is to use a Gaussian fit. However, in the preferences (Peaks tab) you can switch between Gaussian and Parabolic fitting (Peak interpolation method) - and in fact the latest version (3.2.10) also includes a Lorentzian fit.
A couple of things to bear in mind: V3 has the option to view the Peak Symbols as half-heights - this is quite a nice way to check that the fitting is vaguely reasonable (sometimes, if there are overlap issues, then it isn’t!). Use PS to cycle through the different peak symbol types quickly, or else set it in the SpectrumDisplay Settings.
Also, peaks that are close together can be fitted together using RG (rather than RP which does individual fits).
As to how the fits are done: I don’t know to what extent the actual fitting code was changed between V2 and V3. I can check with @ejb. In V3 it uses a certain number of points around the peak position to do the fit (3 or 4 in each direction, I think) and so sometimes (I guess particularly for very broad peaks? Or if you have a high degree of point sampling?) you may find that the peak starting position affects the fit. I wonder whether we should make this a variable that users can set…
Vicky
Hi Vicky,
we compared linewidth between different experiments and noted that the linewidth value displayed in the peak table (LW F1 and F2) are not consistent with the circle shown for the peaks shown as “Filled line Widths”: the larger circles are showing the smaller LW.
This is consistent to what we observe by comparing the traces by eye. And this is true for the 3 fits (Gaussian, Lorentzian and parabolic).
Have you also observed that?
Thanks!
Morgane
Hi Morgane,
it sounds as though you are saying that the linewidth in the table and the one drawn in the spectrum do not appear to be correlated. When testing this just now, it seemed to work as expected for me.
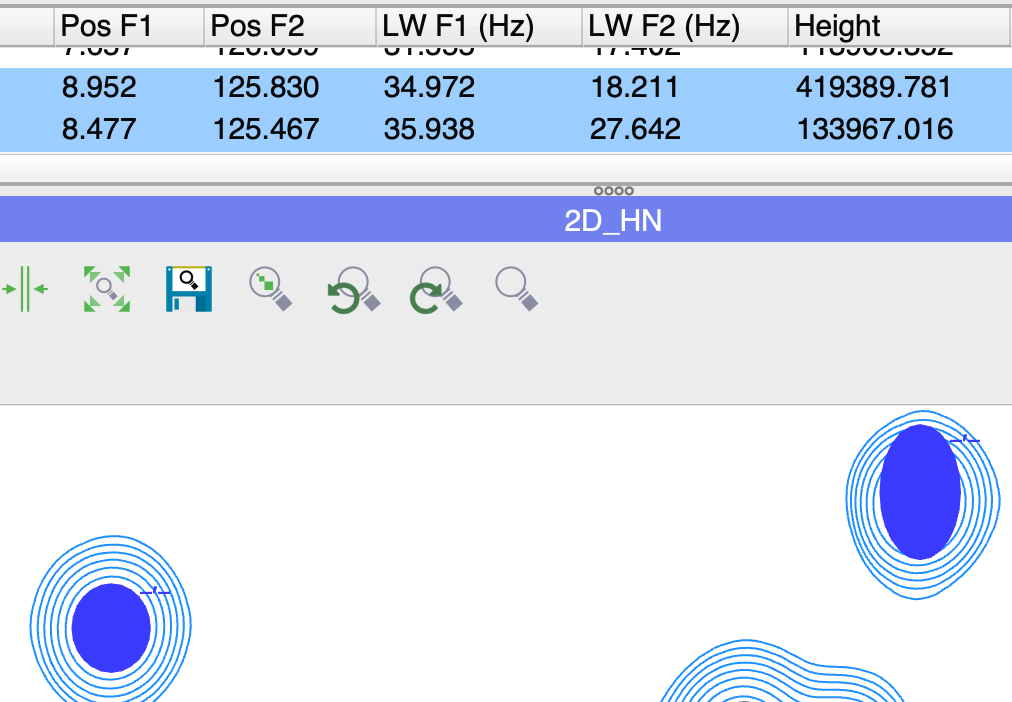
Here the right-hand peak has a larger linewidth in 15N/F2 (27 Hz) in both the table and the spectrum:
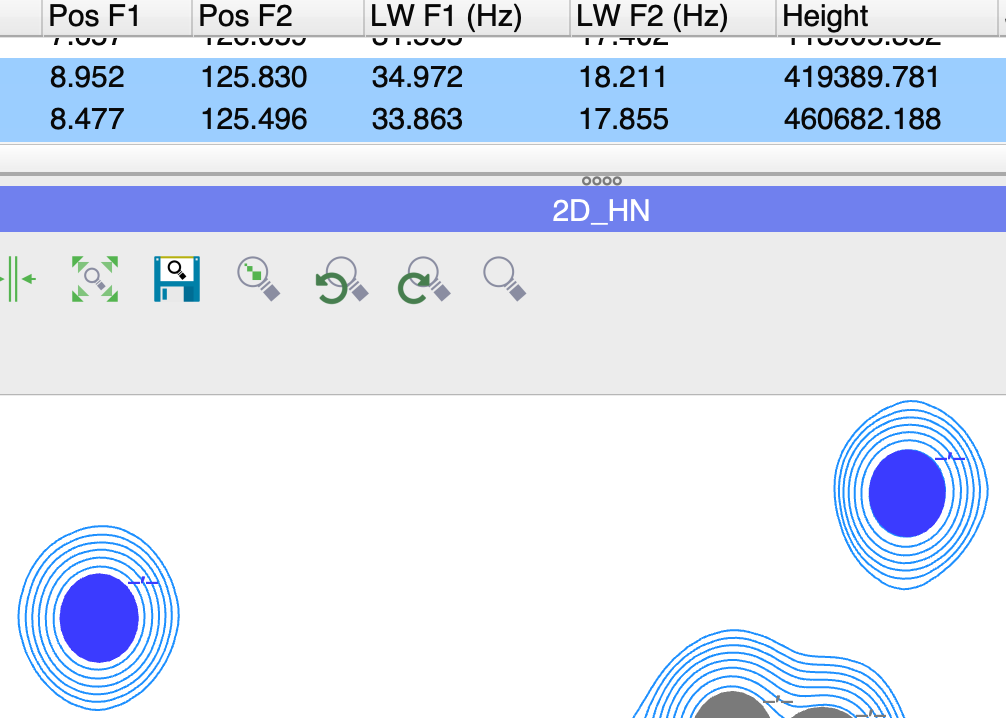
And here they are similar in both:
Are you using the latest version? It should be 3.3.2.1. Perhaps you could otherwise send some images to illustrate what you mean.
Vicky
Hi Vicky,
thanks for your explanations. I have version 3.2.2 and will upgrade to version 3.3.2.1 t test it there. In the meantime, you can see what I obtain here:
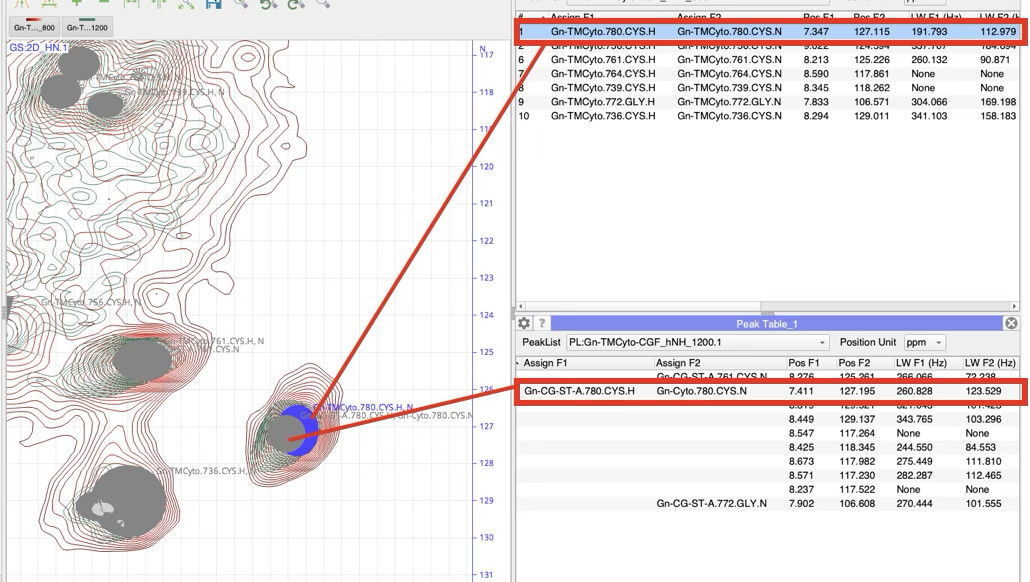
Morgane
Hi Morgane,
could this be an issue with field strengths? It looks as though one spectrum was recorded at 800MHz and the other at 1.2GHz. So on the ppm scale it will look as though one has a smaller line width than the other, but it may still have a larger line width in Hz. I’m afraid at the moment, we don’t offer the option to show line widths in ppm, but perhaps that is something we should add.
Vicky
Hi Vicky,
yes of course, thanks for your help! Linewidth in Hz seem sufficient, if we think about converting them in ppm later ![]()
Morgane
1 Like