Hello together,
my Sequence Graph does not show any colourful connections between Groups. Linking aminoacids is possible and the new link is shown as a black line. But it does not show any colourful connections as it shown when opening your tutorial project (Sec5Part2.ccpn).
I tried to work through starting with Sec5Part1.ccpn, but it seems impossible to activate the colours!
“Show peak assignments” is ticked and ChemicalShiftList selected is CL:default my only one.
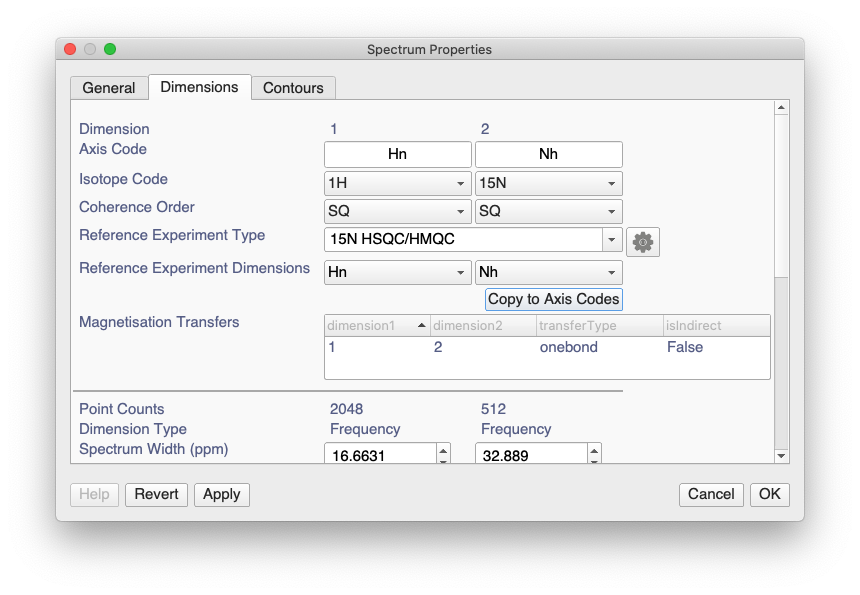
this was more complicated than I was expecting. Basically, in order for this feature to work, you need to set some things in the Spectrum Properties (double-click on a spectrum in the sidebar to bring up the Spectrum Properties dialog).
In the Dimensions tab you’ll need to set the Reference Experiment Type. You will then get some options in the Reference Experiment Dimensions drop-downs. (If all dimensions have different isotopes you’ll only have one option per dimension.) And then finally you’ll need to click on Copy to Axis Code. You may then get a slightly alarming notice asking you to close and re-open some SpectrumDisplays. That is because a change of Axis Codes can otherwise mess up what is going on in the Spectrum Displays.
I think you may then have to close and re-open the Sequence Graph in order for that to update properly - clearly a missing notifier which we’ll fix.
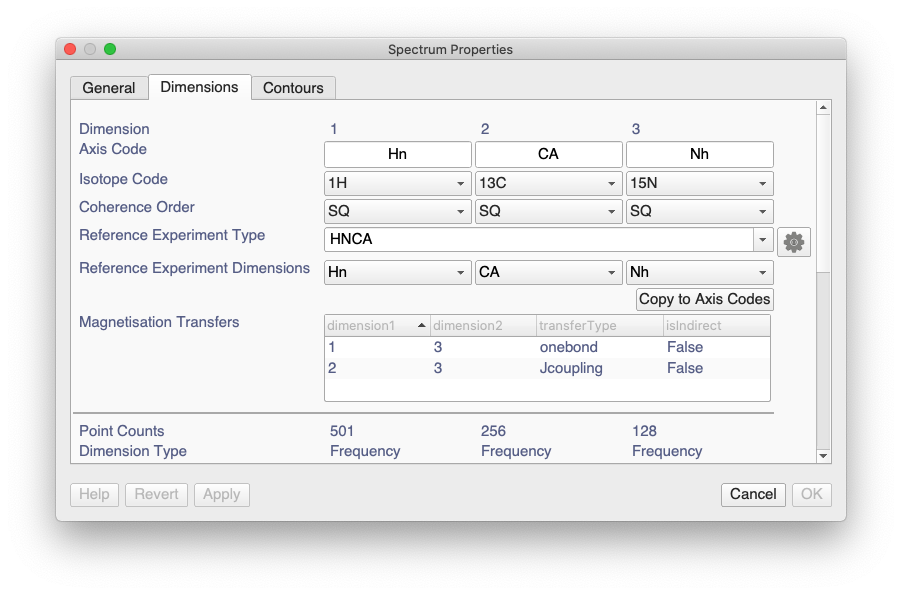
A couple of figures showing you what the Spectrum Properties should look like in the case of an HSQC and an HNCA:
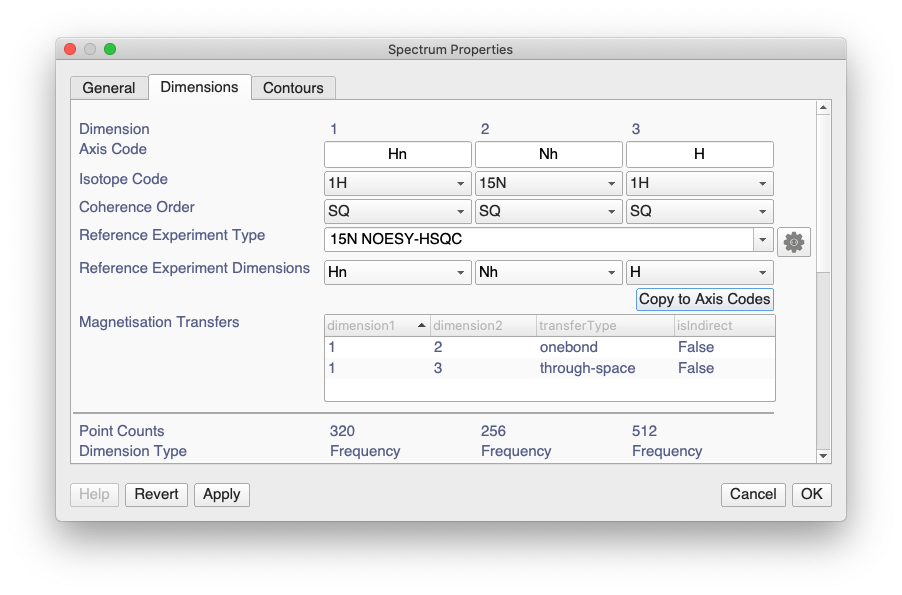
And here is an example for a 15N-NOESY:
Note that the Magnetisation Transfers table below will show you which two dimensions are linked via the onebond NH transfer and which are linked by the through-space NOESY transfer. A good way to check that the two H dimensions have been correctly labelled in the Reference Experiment Dimensions.