Hello,
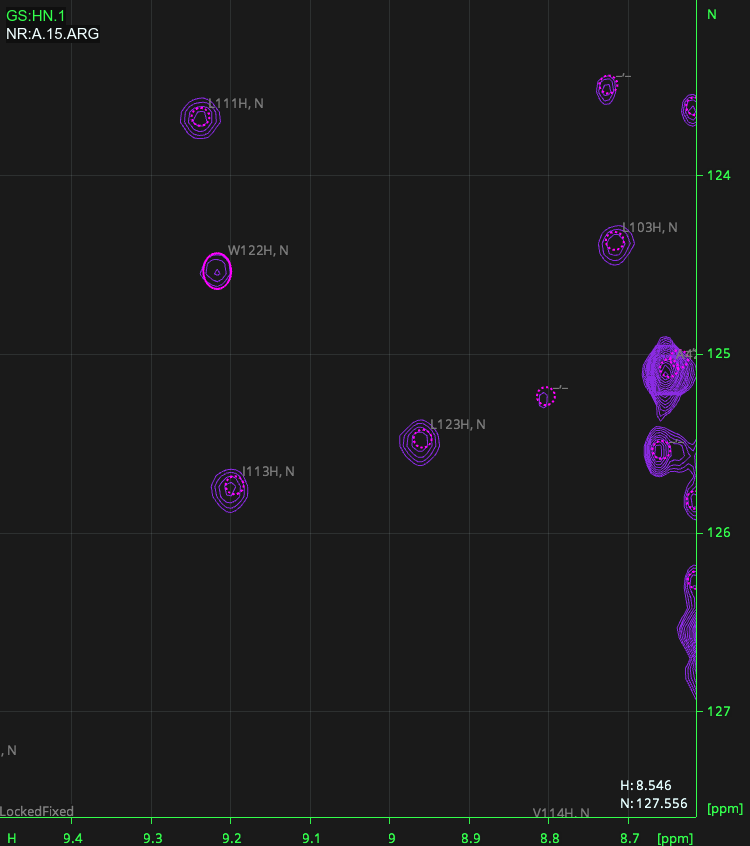
In the attached picture you can see that instead of having a cross in each signal I’ve kind of a circle. I don’t know which shortcut did I typed but I cannot go back.
So two questions,
I’ve seen that if you do the R, P shortcut it creates kind of an elipse, also visible in the picture. What does this describe or is used for?
You can either use the shortcut PS (for peak symbols) to move between/cycle through four different types of peak symbols or if you open the SpectrumDisplay Settings you can set your peak symbols there. Also right-click / Customise should show you the cycle peak symbols (PS) option.
Basically, once you have fit your peak the ellipse is drawn at the half-height of the peak. So this is a good way to check that the fitting is a good fit: the ellipse should basically fit nicely into the contours. If that isn’t the case you should redo the fit. I find that the starting parameters do affect the fitting, so occasionally you have a play around a bit where your peak started (SE and then RG often works well). And if there are peaks that are close to one another/overlapped, you should use the group fitting routine, RG. You will probably see that the fits improve.