Hi, I am still getting used to V.3, but I remember that in V.2 I was able to generate strips with cross-peaks matching a selected diagonal peak in my 3D NOESY data. This is quite important for verifying through-bond assignments generated using standard HNCA, HN(CO)CA, HNCACB, etc. in a large protein. How does one do this in V.3?
Thanks,
Tom Pochapsky
Hi Tom,
I’m slightly unsure exactly what feature you are referring to. But I think (hope) the following will allow you to do what you want to:
If you select your 15N-NOESY diagonal peak(s) and then either go to right-click / Make Strip Plot or use shortcut SP, then you can create a strip plot based on the selected peaks:
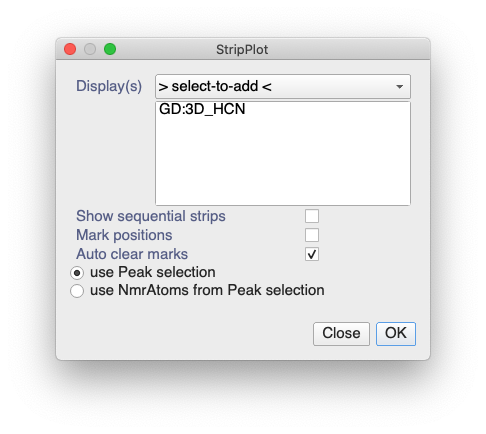
Just make sure you select the Display(s) with your HNCA, HN(CO)CA, HNCACB, etc. in them.
Vicky
Thanks, I’ll try it.
Tom P.