Dear all,
Please can you suggest how to perform relaxation rate (to follow peak intensity change) and NOE analyses in CCPN v3?
I am looking for something similar to (v2):
http://www.ccpn.ac.uk/v2-software/software/tutorials/analysis-beginners/beginners-analysis-2
(Relaxation Rate Analysis part)
and
www2.ccpn.ac.uk/documentation/analysis/popups/CalcHeteroNoePopup.html
1 Like
Hi Yulian,
you should be able to do this using the chemical shift mapping module. Have a look at the Chemical Shift Perturbation Tutorial (under Help / Tutorials). Obviously your peaks shouldn`t move, so it should be easy to copy the peaks from one spectrum to another and then do SE (snap to extremum) on all peak simultaneously. Then in the settings box of the chemical shift mapping module select Calculation Mode `heights` rather than `position` and Fitting Mode `Exponential`.
Vicky
1 Like
Hi Vicky,
Thank you for the reply.
Please can you also suggest how can I extract the fitted T1, T2 (R1, R2) values?
Also, is there a way to get NOE values or it is not implemented yet?
Hi Yulian,
just realised that nobody ever got back to you about this.
You can export any table by right-clicking on it and then exporting to an Excel or comma/tab separated or .json file.
NOE values are not implemented yet, but again, you might be able to use the Chemical shift Mapping module as a bit of a hack and then export to Excel for the time being.
We now have a list of popular V2 features and if/how they are implemented in V3:
https://www.ccpn.ac.uk/forums/misc.php?a...elp&hid=64
Best wishes,
Vicky
Hi Vicky,
On these lines, I have tried to extract the values of relaxations rates by using the fitting to a exponential decay. It worked nicely and is great to have a quick look to the data.
However, I would like to also look at the fitting errors to see if a certain peak is overlapped/not reliable. Is there an option to look at fitting error to exponential decay fitting in the CSP module?
Thanks a lot in advance,
Hi Borja,
we don’t calculate any errors as such when fitting the exponential decay, but you can look at the fitting in the Fitting tab next to the table and this should give you an idea of how good the fit is and whether there are individual data points that are outliers or not.
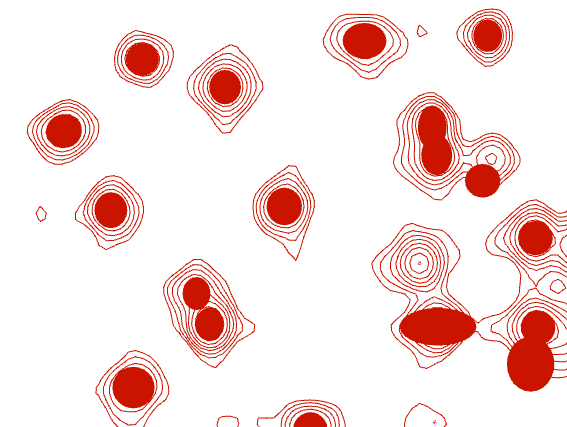
The other thing you can do is that you fit the individual peaks with RP (Refit peak). This should give you good peak positions and is used as the basis for volume estimation. Where there is a bit of overlap, select all peaks and do RG (Refit Group) to fit several peaks simultaneously. You can then go to the Settings panel in your Spectrum Display and select Peak Symbol as “Filled lineWidths” and then that should give you an idea of how well the peak fitting has worked - ideally the filled line width should sit nicely in the contours. here you can see an example of some peaks that were fit nicely and others that weren’t.
Hope that helps,
Vicky
Thanks Vicky for the quick response.
I was looking at the fiting tab but what is shown is the “relative displacement” in the y-axis. Is there an option to look at height/volume instead.
Thanks,
Sorry - the axis label saying “relative displacement” is just a hardcoded piece of text at the moment. As long as you can see the curves, then you can assume that the values are in fact the height or volume (whatever you selected in the settings).
Vicky
Hi Vicky and Team
Thanks to your tip about using (S,E) after copying the peak list from the first place to the next with my T1 data, I see that the peak list for the second spectrum reflects the change in intensity. But, when I select the peaks and tried to calculate the volumes using (E,V), nothing seems to be happening. My intention is to use the volume to do the R1 fitting using the Chemical Shift mapping module, as you had shown earlier, instead of the peak heights. In my case, the inherent noise will make the fit poorer.
Can you guide me as to how to extract the volumes of the peaks ?
Thank you very much.
Rajan
By the way, the Chemical Shift mapping module, does include a radio button for ‘volume’, apart from the ‘height’. Also, to repurpose this CSP method, I am supposed to select ‘raw’ instead of ‘delta’, am I right ?
Thank you
Rajan
Continuing on the above thread, I managed to setup the exponential decay fit using Peak Heights via Chemical Shift Mapping module. I also did a ‘Edit Series’ in the setup window (gear icon) and entered my relaxation delay times for each spectrum. The fits now appear in the Fitting tab. But, what do I understand from the ‘Ddelta’ and ‘Kd’ columns ? Since I am repurposing the CSP analysis module to get R1 decay rate, I can hazard a guess that the Kd is the fitted parameter ‘R1’ in my case. What doesn Ddelta signify ? Should I just ignore it ?
Since I am not able to see the actual fit equation used here, I have this doubt.
Thanks again.
Rajan
Hi Rajan,
as regards peak fitting and volume calculations:
In order to calculate the volume you need to have line widths specified. If you placed your peaks manually and then did SE you won’t end up having any line widths (open the peak list to check). Now there are two ways you can generate/end up with line widths. One is if you do Ctrl+Shift+drag to pick your peaks. In this case the program just does a quick analytical fit. The other (probably better) way to do it, is to do a proper least squares fit which you can do with RP (or select peak and then right-click / Refit Peaks). The reason we don’t do this as standard is because it takes a bit longer. (On an HSQC it’ll still be pretty quick, but if you were peak picking a 3D NOESY with several thousand peaks, this would become a speed issue.) Once you have the line widths you can then do Estimate Volumes (EV) - either on the selected peaks or a whole peak list. Remember that overlapped peaks should be fit with RG (refit group) which will fit several peaks together and probably give you a better fit.
And yes, you need to specify ‘raw’ rather than ‘delta’ if you are repurposing the CSP module for dynamics data.
I’ll check on the equations and parameters and get back to you on that one later.
Best wishes,
Vicky
Right, now for the equations and parameters etc.
One Site Binding based on positions
The equation is
y = (Bmax * x) / (x + Kd)
The Kd is shown in the Kd column. Bmax is not currently reported.
The Ddelta column shows the “distance” between the first and last data points, i.e. the peak positions in the first and last spectra. The distance, d, is calculated using equation (9) from
M.P. Williamson Progress in Nuclear Magnetic Resonance Spectroscopy 73 (2013) 1–16
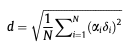
The alpha factors are the “relative contributions” you set for the different types of nuclei in the NmrAtom Settings part of the Settings panel.
Exponential Fitting with heights/volumes
The equation is:
y = amplitude * (1-e(-x/decay)
Here the decay is shown in the Kd column and the amplitude is not currently reported. (You may want to keep an eye on the units you select in your Series setup to make sure you are not out by a fact of 1000 or something like that.)
The Ddelta column should give you the ratio of the first and last heights or volumes. (This means you could use this for the Heteronuclear NOE calculation if you wanted.)
Vicky
1 Like
Hi Vicky
It’s great to know that I can generate the hetNOE straight from this module. Superb ! Just so I do this correctly, for my hetNOE calculation, I will simply load the two 2D planes, one the control and the other with saturation. Now, I shall go through the motions of a ‘fit calculation’ using the Chemical Shift Mapping module but simply ignore the unwanted Kd column but just hang on to the Ddelta column for each residue. Does this sound right ? If this is so, then I hopefully can export this into a simple table (csv or .xls) and figure out how to use that further. My immediate intention is to make PyMol color code the protein based on the above in some kind of thermal map. If you have a tip for that, that will be cool !
Thanks so much, guys. I can’t appreciate you enough for making this work.
Best
Rajan
Hi Vicky
I found the following problem, when I tried using RP as well as RG. I can say with confidence that the saturated NOE HSQC plane’s peak heights are smaller than that of the Control plane (the expected behavior for 1H-15N hetNOE), when look at the spectra and 1D slices on Topspin bruker software. But, when I imported these spectra into Assign and tried to compute the height of the cross peaks (as well as volumes, later with EV), inexplicably the peak heights reported for my Control spectrum are smaller than those for the Saturated NOE plane. How can I explain this ?
I am hazarding a guess that when I use RP or RG, some kind of peak fitting procedure is used and the peak heights are derived from the fitted shape, am I right ? Is this the source of error in my case ?
Thanks
Rajan
Hi Rajan,
I suspect that this is nc_proc related. When you process your spectra in Topspin it scales it with a parameter called nc_proc. With any data where you are wanting to compare intensities outside of Topspin, it is important that all the spectra were processed with the same nc_proc parameter. You can manually set the nc_proc factor when processing.
In fact, from Version 3.1.0 onwards Analysis will finally read in the nc_proc factor and automatically do the scaling for you. But in all previous versions you have to make sure the nc_proc values are the same.
Here are some useful instructions from the old V2 Mailing list made by Pat Edwards:
Process all your spectra as normal using xfb (or multixfb)
For each spectrum use the command “dpp” and note the value of
NC_proc (or alternatively use grep to search the procs files: i.e.
%grepNC_proc /*/pdata/1/procs)Note the largest value and then reprocess the data using the
command"xfb nc_proc " i.e. if you had
three spectra
for which the values of NC_proc were -3, -1 and 2 your would use “xfb
nc_proc 2”Use dpp (or grep) to verify that all spectra now have the same
valueof NC_proc.The data can now be used with Analysis.
Here is the info about nc_proc from the Topsin manual which will give you some background information:
NC_proc - intensity scaling factor
• used in 1D, 2D and 3D datasets in the first direction
• takes an integer value
• set by all processing commands
• only exists as processing status parameter
• Processing in Topspin performs calculations in double precision floating point but stores
the result in 32-bit integer values. During double to integer conversion, the data are scaled
up or down such that the highest intensity of the spectrum lies between 228 and 229. This
means the 32 bit resolution is not entirely used. This allows for the highest intensity to be
increased, for example during phase correction, without causing data overflow. NC_proc
shows the amount of scaling that was done, for example:
– NC_proc = -3 : data were scaled up (multiplied by 2) three times
– NC_proc = 4 : the data were scaled down (divided by 2) four times
• Although NC_proc is normally calculated by processing commands, 2D processing also
allows you to predefine the scaling factor with the argument nc_proc, for example, xfb
nc_proc 2, scales down the data twice. However, you can only scale the data more down
(or less up) than the command would have done without the argument nc_proc. The latter
is shown by the processing status parameter NC_proc (type dpp). Smaller (more
negative) values of nc_proc are ignored to avoid data overflow. The command xfb
nc_proc last takes the current value of the processing status parameter NC_proc (type
dpp) as input value.
Best wishes,
Vicky
1 Like
Hi Vicky
Sorry for the hiatus. But I can add that your suggestions worked fantastic and I am able to get the expected results using both Peak height and Volume for my HetNOE data ! Thank you so much.
My current box is FC34 and somehow it didn’t open my PDB file with PyMol and map the NOE values onto the structure. But I went on a limb and upgraded my Linux box in my home office to FC36 and there it worked beautifully. Hope this helps for someone who is trying to live on the bleeding edge like me.
The NC_proc command was educational and honestly I haven’t worked with it before. Thank you for kindly enlightening me.
One question regarding the PyMol color mapping. What is the binning resolution the software uses to map the colors onto the protein structure ? I see that there is a one-to-one correlation between the colors used in the bar graph within Assign and the colors on the structure. But, is there a way one can subtract the average NOE value using the trend line on the bar graph and then use the resulting NOE distribution along the residues to paint the molecule with more colors ?
Thank you
Rajan
Hi Rajan,
great that this is working!
At the moment our scripts only allow the use of the two colours in PyMol (you can select which colours in the Settings panel and set your threshold manually but that is all).
I think someone else has already suggested having some kind of grading which runs the colours into one another relative to the height of the data points. I shall remind @LucaM of this when he is working on this module over the coming weeks.
Vicky
Hello everyone!
Sorry to ask if this has already been answered. I was wondering if there is a Relaxation Data Analysis Module (alpha) tutorial anywhere (the macro module I mean). If there is none, may I ask for your assistance using it, I am not very good figuring out how it works. Thank you in advance!
Best regards,
Fran.
Hi Fran,
we don’t have anything on this yet, but have a deadline to get a tutorial done by a week on Friday for a workshop we are running here in Leicester. We’ll make it available on our website on the Tutorial page.
Best wishes,
Vicky